
Flow Cytometry is a technique used to detect and measure the physical and chemical characteristics of a population of cells or particles. In this process, a sample containing cells or particles is suspended in a fluid and injected into the flow cytometer instrument.
Flow cytometry provides a well-established method to identify cells in solution and is most commonly used for evaluating peripheral blood, bone marrow, and other body fluids. Flow cytometry studies are used to identify and quantify immune cells and characterize hematological malignancies.1 They can measure:
The ability to perform these measurements in a very rapid time span is one of the key advantages of the flow cytometric process. They can quantify up to three to six properties or components are quantitated in a single sample, cell by cell, for about 10,000 cells, in less than one minute.
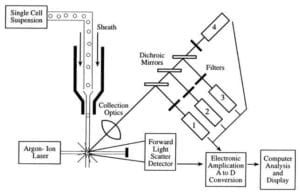
Flow cytometers take in a suspension of monodisperse single, unclumped cells and run them one at a time (single file) past a laser beam where each cell passes through the laser beam, scattered and fluorescent light and are then counted and sorted or further characterized.
One of the main principles of using flow cytometry is the ability to analyze the complete cell cycle and analyze DNA content in different phases. Monitoring the natural events of the cell cycle can provide information for disease diagnosis and therapy prognosis. The different phases of the cell cycle can reveal altered DNA content and other anomalies indicated tumor presence or signs of advanced cell death. The data expressions are stored in a computer via specialized flow cytometry software associated with chosen instrument use during the time of analysis. Flow cytometry data is typically reported in two distinct ways: a histogram and/or a dot plot2.
| G1 phase: | RNA, ribosomes and proteins are synthesized |
| S phase: | DNA is replicated |
| G2 phase: | Represents the phase between DNA synthesis and mitosis |
| M phase: | cells are divided into two daughter cells |
Fluorescence-activated cell sorting (FACS) is a specialized type of flow cytometry. It provides a method for sorting a heterogeneous mixture of biological cells into two or more containers, one cell at a time, based upon the specific light scattering and fluorescent characteristics of each cell. It is different from flow cytometry in the way that it provides unique characterization versus merely counting and sorting cells. It is common for the two principles to work in a co-characterization type process to offer a complete qualitative and quantitative approach to flow cytometric analysis.
The cell suspension is entrained in the center of a narrow, rapidly flowing stream of liquid. The flow is arranged so that there is a large separation between cells relative to their diameter. A vibrating mechanism forces the stream of cells to break into individual droplets. The system is adjusted so that there is a low probability of more than one cell per droplet. Just before the stream breaks into droplets, the flow passes through a fluorescence measuring station where the fluorescent character of interest of each cell is measured.
An electrical charging ring is placed just at the point where the stream breaks into droplets. A charge is placed on the ring based on the immediately prior fluorescence intensity measurement, and the opposite charge is trapped on the droplet as it breaks from the stream. The charged droplets then fall through an electrostatic deflection system that diverts droplets into containers based upon their charge. In some systems, the charge is applied directly to the stream, and the droplet breaking off retains charge of the same sign as the stream. The stream is then returned to neutral after the droplet breaks off.
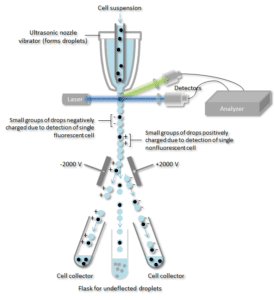
An antibody specific for a particular cell surface protein is associated with a fluorescent molecule and then added to a mixture of cells. The next step is the process of fluorescence, whereas, specific cells pass through a laser beam they are monitored. Droplets containing a single cell are assigned a positive or negative charge, based on whether the cell has a fluorescently-tagged antibody. Droplets containing a single cell are then detected by an electric field and diverted into separate collection tubes according to their charge allowing for easy separation of the cells marked with the fluorescent antibody.
Multicolor flow cytometry is a useful technique when examining mixed populations of cells, such as blood and tissue cells in human and animal samples. Generally, a specific cell type is marked with fluorescent dye (markers) like fluorophore or propidium iodide. The ability to use multiple fluorescent markers simultaneously allows for the identification of multiple cell types, as well as functional markers that further characterize each sample. There are specialized instruments capable of measuring 12-plus colors 3,4 . These fluorescent dyes and markers are measured by different wavelengths of light emitted from the laser to sort by individual cell type. Each marker is excited at a specific wavelength of light to differentiate them when using multiple markers.
Adapting a typical staining panel from 4 to 6 colors to more than 12 colors is not simply a matter of “plug and play”, it must be approached in a systematic manner to achieve successful parameters in a staining panel. The basic principles of panel design work best based upon pre-use research. In other words, preparation is key even from the beginning process of referring to the stain index in regards to effectively matching fluorochromes by brightness5.
Flow Cytometry Tip: Put in some time to understand the subtle nuances of your flow cytometer before designing your primary antibody panel. Focus on where the most sensitive measurements can be made on the system. There is more to the story than merely fluorescent intensity. Consider substituting for a less bright fluorochrome to avoid channel errors.
Flow cytometry is an integral component in several clinical areas, including diagnosis, treatment plans, and systemic disease whether static or progressive. As we learn more about the practical applications for use in flow cytometry, the knowledge base is further expanded. Now, more than ever before, researchers are very excited about being able to learn more about the complexities of certain diseases and conditions. It has led to a swift change in diagnosing patterned and drastically altered medical approaches to treating diseases such as cancer6.
Flow cytometry methodology is often involved with other comprehensive testing patterns such as morphologic examination. In many cases, hematologic neoplasms depict specific morphologic changes, and flow cytometry provides greater specificity and helps pathologists expand on tissue anomalies or other advanced disease. Flow cytometry, in some cases, can pre-determine the recurrence of cancer before morphologic changes are detected7.
A few of the major applications used in the scope of modern clinical settings both therapeutic and research oriented include:
The basic principles of flow cytometry have changed little in the past decade, but the applications of this technology have evolved a great deal. The foundations of flow cytometry have been consistent with its primary function, which is to interrogate individual cells or particles in a stream with a laser as the cells move past a set of stationary detectors. Increasingly, more colors of fluorescence are being detected by cytometers, alongside with high speed sorting and analytical function8.
Flow cytometry plays an integral role in molecular science research and continues to evolve at a rapid rate. There are several commercial flow cytometers on the market. They tend to operate on the same basic principle, but there are important differences in their design, and concepts on alignment and integrating other components.
Soon on the horizon, a 3D instrumentation will be introduced and incorporated in a hybrid proprietary instrument produced by NanoCellect Biomedical, the WOLF Cell Sorter. We can also look forward to the development of narrow spectrum fluorescent probes, the integration of molecular biologic techniques with flow cytometry, and the evaluation of cell-free markers such as cytokines will be key components in the continuing evolution of flow cytometry analysis and cell assay technology.
Sources:


