1.1. Flow cytometry – definitions, principles and uses Flow cytometry is a technique used to detect and measure physical and chemical characteristics of a population of cells and particles. A sample containing cells is suspended in a fluid (sheath) and injected into a flow cytometer; the sample is then focused to ideally flow one cell at a time through a laser beam. The light scattered by each cell is characteristic to that individual cell’s size and its intracellular components. Cells are often labeled with fluorescent markers so that the light is first absorbed and then emitted in a band of wavelengths specific to the given marker. Flow cytometry is used in many different settings, including basic and applied research as well as a clinical diagnostic tool. The data acquired can be used for cell counting, specific cell type or cell functions characterization, biomarker detection and diagnosis.
1.2. Analysis and Sorting Flow cytometry is an imaging technique with an ever-growing array of complex instrumentation available for researchers to use. Broadly, two types of flow cytometers are currently on the market: flow analyzers and flow sorters. Flow analyzers are analytical and diagnostic instruments, often built with multiple lasers and a wide variety of detectors. These instruments are often able to visualize and analyze complex and diverse multi-color samples, extracting quantifiable data. Flow sorters are complex instruments that go beyond analysis and data visualization because they can physically separate and thereby purify or ‘sort’ defined cell sub-populations of interest based on their optical properties. The sorted cells can be used for downstream assays or for further analysis. This method is called Fluorescence Activated Cell Sorting (FACS).
2.1. Principal components of a flow cytometer A flow cytometer is a complex instrument composed of three main systems: fluidics, optics, and electronics (Figure 3.1). When the three systems work in conjunction with one another, the user can acquire a great deal of information about a given cell or population. Each of the three systems serves an integral purpose leading to the acquisition of data. The fluidics system transports the cell sample from its tube, throughout the system and flow cell, and to an outlet port. The optics system is responsible for illuminating the sample, as well as transporting and collecting the light scatter and emitted fluorescent light to the detection system. The electronics system is responsible for digitizing and further processing the signals obtained from the detectors for subsequent analysis. In flow sorters, the incorporation of a sorting mechanism enables the capture of a specific subset of cells from a heterogeneous population. The WOLF G2 possesses optics and electronics systems like traditional cell sorters. However, unlike traditional sorters, the WOLF G2 employs a microfluidics-based sorting mechanism that operates at a considerably lower pressure, resulting in gentler treatment and higher viability of the sorted cells.
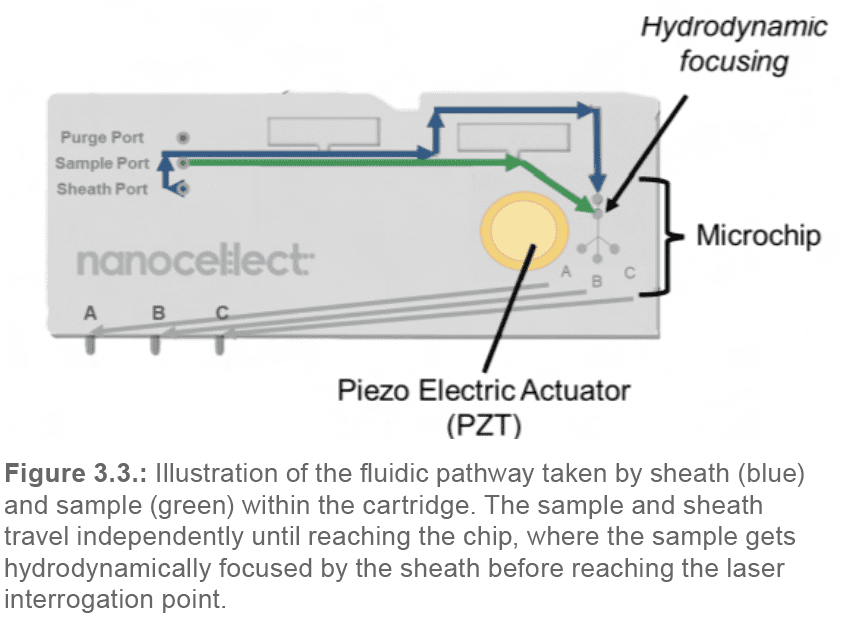
2.2. Fluidics system – the innovation is the cartridge! Unlike traditional cell sorters, the fluidics system of the WOLF G2 is completely contained within disposable microfluidic cartridges. The system itself contains no internal fluidic components. Each microfluidic cartridge, packaged in a sterile pouch and equipped with an individual QR code, consists of a series of tubing and channels designed to move the cell sample throughout the system. Once the cartridge is ready for analysis, the sample solution and sheath buffer are taken up into the tubing as the two peristaltic pumps rotate (Figure 3.2).

The sheath and sample solutions travel independently through separate channels within the macro-cartridge until they reach the cartridge microchip. There, the sheath surrounds the sample and hydrodynamically focuses the cells into a stream of single cells (Figure 3.3).
From that point, the hydrodynamically focused sample solution continues towards the laser interrogation point at the chip center. There, each individual cell is interrogated by the two pulsating lasers. As the cell passes by the sorting junction, depending on its properties and the sorting parameters pre-set by the user, it will either get sorted into the A or C channels, or flow into the B-waste channel (Figure 3.4.).
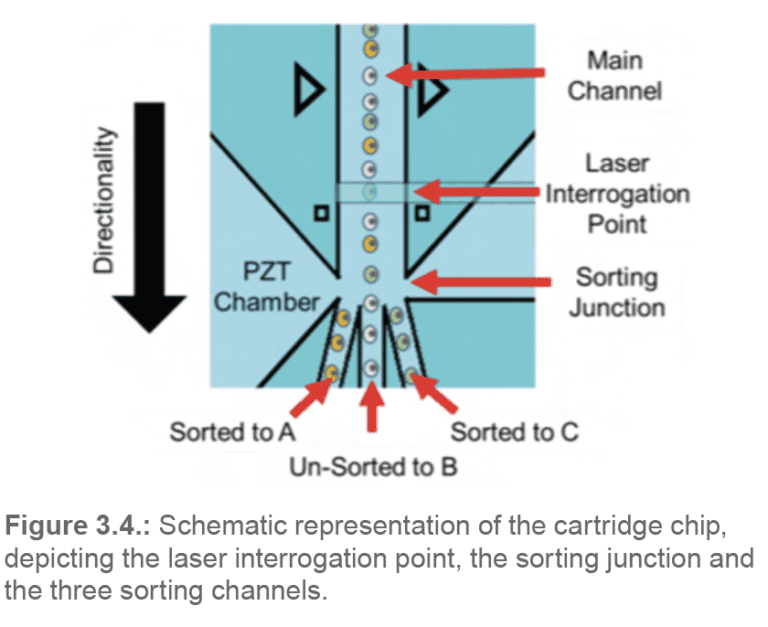
The sample then continues its progress through separate channels towards the outlet ports (A, B, C). If the cells are sorted in bulk, droplets containing the sorted cells form at the A and C outlet ports; the unsorted cells drip out of port B. The droplets fall by gravity into the collection tubes below. If the cells are sorted in single-cell mode using the N1 Single- Cell Dispenser, the sorted solution travels through additional tubing lines extending from the A and C outlets to a needle head. This needle head attaches to the N1 motor head, which will move in the X, Y and Z directions to submerge the tubing line directly into each well of the 96 or 384 well plate.
2.3. Optics System The WOLF G2 cell sorter comes equipped with two 55mW lasers in three possible configurations. The 488nm blue laser is present across all configurations, complemented by either a 405nm violet laser, a 561nm yellow laser or a 637nm red laser. In addition to forward and back scatter, the WOLF G2 can detect up to 9 colors (depending on the configuration) and offers great flexibility to the user in terms of multi-color assay development. The entire optical pathway is stationary; the only mobile part within the system is the cartridge, situated within a fixture. A semi-automated algorithm moves the fixture in the X, Y and Z directions to align the cartridge to the laser beams. Like traditional flow cytometers, the WOLF G2 utilizes mirrors, dichroic mirrors, filters, lenses, and pinholes to direct the laser light towards the cell sample and collect the scattered and emitted light into a series of detectors. Each component of the optical pathway possesses a unique, yet critical function designed to capture information about a single cell:
2.4. Electronics
The pathway from cell detection to a dot on a dot plot consists of three main steps:
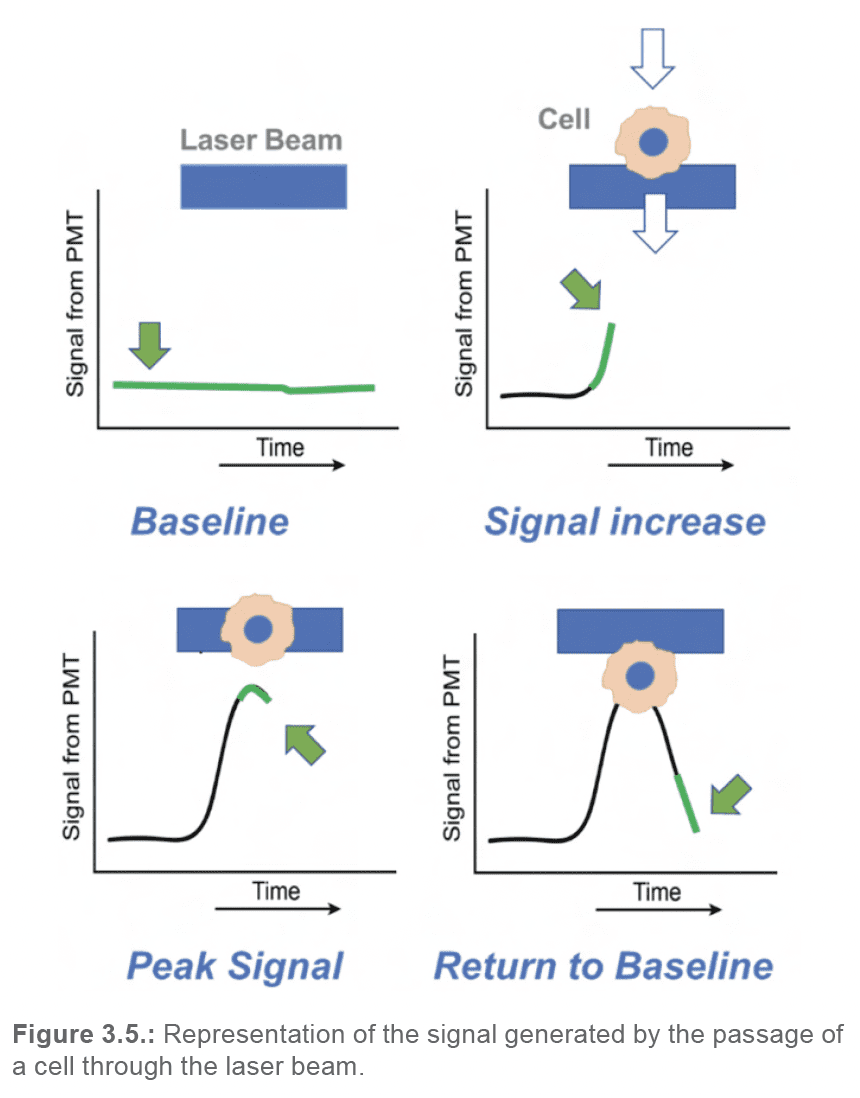
Within the WOLF G2 Cell Sorter, there are seven different detectors that are constantly collecting data: one silicon diode detector collecting forward scatter data, and six photomultiplier tubes (PMTs) collecting backscatter and emitted fluorescence data. The five PMTs collecting fluorescence data are shared between the two lasers, which can allow for up to nine fluorescent channels worth of possible fluorochrome combinations (depending on the laser configuration). When the lasers are powered on, each of these detectors will possess a baseline signal that should remain constant over time. When a cell enters the laser beam, there will be a measurable increase in signal over the baseline. The peak measured signal intensity will occur when the event is centered within the laser beam; subsequently, as the event passes by the laser, the measured signal will return to baseline. Therefore, as each event passes by the laser beam, a pulse of signal will be generated and recorded by each detector (Figure 3.5).
Each of these pulses can be reduced to a set of characteristics (Figure 3.6.):
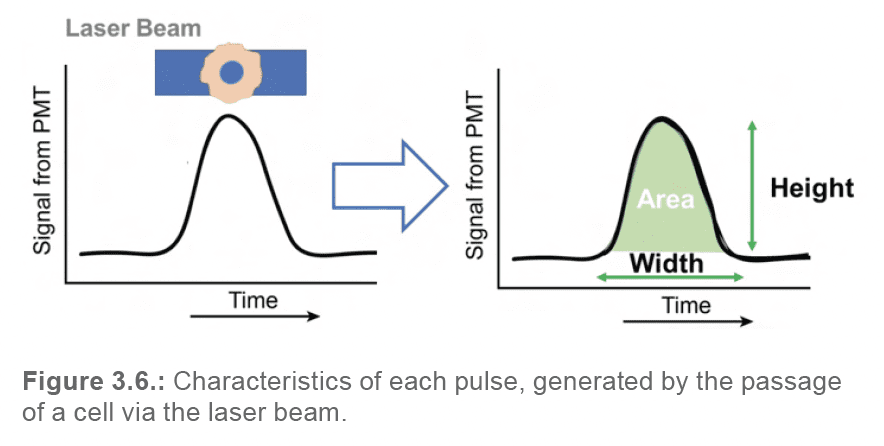
By translating each pulse into numeric data, and by plotting these values in the format of a dot plot or histogram, user can begin to visually assess the morphology and fluorescence of their particles, and select the events required for their application.
2.5. Sorting mechanism and verification Unlike traditional cell sorters that utilize electrostatic charges to deflect cells towards their respective sorting channels, the WOLF G2 utilizes a low-voltage piezoelectric actuator (PZT) situated within the cartridge chip to gently redirect the flow of the sample-sheath solution. Rather than apply a charge directly to cells, the WOLF applies a charge to the PZT, inducing it to pulse in two different directions, thus applying a mechanical push/pull force on the fluid within the chip (Figure 3.7).
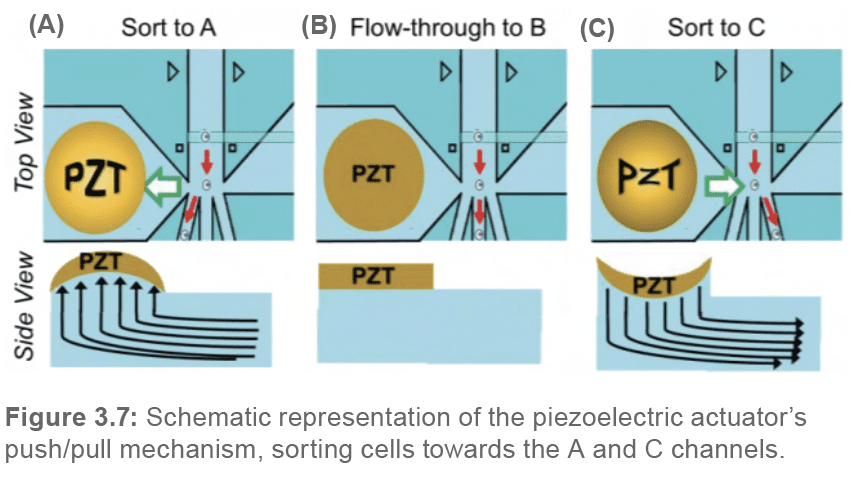
As mentioned previously, there are three different outlet channels (A, B, and C) at the sorting junction located within the cartridge chip. The stream of fluid, if not altered by a PZT pulsation, flows straight into the middle channel (channel B), which constitutes the waste or flow-through channel. To sort a cell to the A-sorting channel, the PZT will pulse upwards, thus pulling the fluid underneath, diverting the flow towards the A channel. Alternatively, to sort a cell to the C-sorting channel, the PZT will pulse downwards, thus pushing the fluid underneath, diverting the flow towards the C channel. To ensure that each cartridge is sorting efficiently, the user performs a calibration step during the set-up process, using green calibration beads. The calibration step can be compared to determining the “drop delay” in traditional cell sorters; it serves to determine the best time delay between laser detection of a target cell and PZT pulsation to sort the same cell. The calibration step is an automated algorithm that systematically assesses the sorting efficiencies at variable PZT pulse delays. To assess whether a bead was sorted into the appropriate channel, the WOLF G2 utilizes a secondary optical sorting verification (OSV) system (Figure 3.8.).
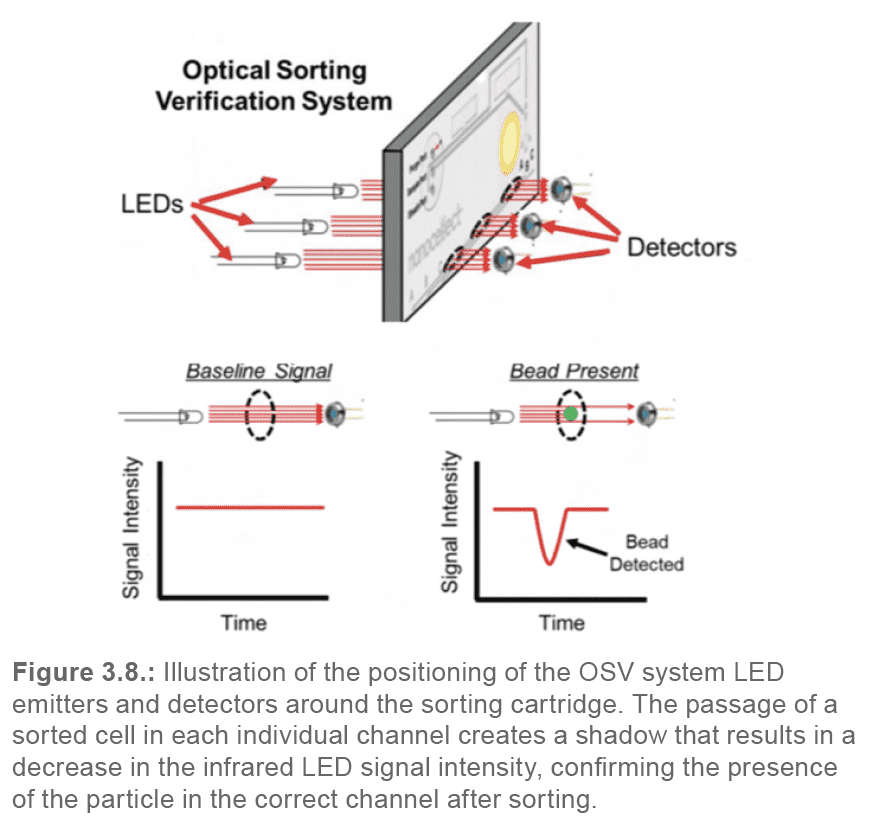
The OSV system is comprised of three infrared LED emitters located on one side of the cartridge fixture, and three detectors on the other side. The cartridge sits between the emitters and detectors; each emitter/detector pair lines up with one of the three outlet channels (A, B, C). When a bead passes by the light/detector pair, it will block the transmission of light into the detector. Measuring the signal intensity over time in each detector enables the algorithm to determine the sorting efficiency at each tested PZT pulse delay. The algorithm then automatically chooses the best delay for the individual cartridge.
The microfluidics WOLF cell sorter is a user friendly and gentle sorter, that permits an easy design of multi-color experiments with high quality results. Considerations need to be given to the microfluidic nature of the system. Thoughtful upstream sample preparation will ensure optimal sorting and high-quality downstream assay results.