The cell cycle refers to the series of events that occur during cell division. The end of the cell cycle analysis refers to the full quantified expression data learned from the completed DNA analysis of the cell division process1.
Cell division occurs through a series of checks and balances known as the cell cycle. This cycle has four main stages, called gap 1 (G1), DNA synthesis (S), gap 2 (G2), and mitotic (M) phases2.
G0 The beginning of the cycle whereas the cell is properly activated.
G1 The cell growth begins.
S The cell cycle stage where nuclear DNA content doubles to 4N.
G2 The period where cell growth is maintained at 4N.
M The period where cell division occurs resulting in two daughter cells each with a DNA content
Flow cytometry is one of the most preferred ways to complete the cell cycle process. It offers the ability to study large numbers of cells individually and allows for the simultaneous analyzing proteins such as certain biomarkers or signs of apoptosis. The first clinical flow cytometer was introduced in 1983. Since then, we have seen many advancements in both scientific instrumentation and operating procedures.
These improvements continue to result in significantly improved processes with regards to analytical chemistry. The industry surrounding molecular diagnostics is experiencing progressive momentum making it a really exciting time to be involved within the research community. The upwards shift primarily due to the pharmaceutical landscape. New discoveries help to further the cell line development of more effective therapeutics.
Related: Why Flow Cytometry in Immunology is Important
The ability to measure a minimum of five parameters on 25,000 cells in one routine has been a game changer when it comes to understanding various disease states. High-speed cell-sorters using digital technology assists in the beginning processes of the cell-cycle analysis process. However, incorporating the use of flow cytometry to record measurements on each cell has somewhat altered many of the downstream processes3.
Flow cytometry can be used in the scope of biochemical analysis for further RNA sequencing analysis and DNA characterizations.
As a general practice, flow cytometers are designed specifically to be multiparameter, but even still most commercial cytometers have the capacity to make five or more simultaneous measurements on one single cell. Some proprietary research instrumentation exhibits capabilities of analyzing up to 11 parameters possible with 3 lasers. In the future, we are likely to see 3D models that work within the cell sorting process itself. As of this moment, fluorescence-activated cell sorting, or flow cytometry, allows for quantification and characterization, but does not produce an 3D image of the cell.
Flow cytometry and cell sorting are not opposing methodologies. They are rather complementary to one another. Both rely on antibodies to detect specific cells within a heterogeneous population, but while flow cytometry is used primarily as a measurement tool, cell sorting is designed to help achieve characterization.
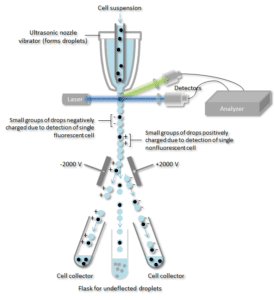
Fluorescence-activated cell sorting (FACS) is a specialized type of flow cytometry. It involves the sifting through heterogeneous mixture of biological cells into two or more containers, one cell at a time, based upon the specific light scattering and fluorescent characteristics of each cell. The flow cytometry analysis serves to distinguish the cells in different phases. Each cell cycle phase is unique and these methodologies enable in-depth analysis. This process includes understanding flow cytometry gating. For this particular purpose, completing the flow cycle is the next logical step in the molecular analysis process and does not detract from the original reasoning behind sorting cells, which are:
1) To characterize and sort via cell-phenotype
2) For the purposes of cloning and the development of cell lines.
Although different processes, the concept for managing the cell analytical process are relatively the same. They both serve to maintain the integrity of the cell while also enlisting a high level of accuracy and precision with regards to exploiting data expressions. The distinctions are narrowed by instrumentation, modality, and field of application.
Cell cycle progression has historically been monitored using flow cytometry. The nuclear content of a cell can be quickly quantified using flow cytometry assays. Cell cycle progression is a tightly regulated process that involves the duplication of nuclear DNA content prior to cell division. The control mechanisms that ensure cell cycle regulation are often disrupted in tumor cells and serve as viable targets for therapeutic compounds in the treatment of cancer4.
Flow cytometry is also helpful determining apoptotic cells in addition to specific mechanism of actions with regards to the DNA process. Of the many advantages of flow cytometry, there are some things it can’t accomplish such as providing cytodynamic information such as traverse rates and phase transit times5.
Some measurement application protocols focus strictly on DNA only. The cells are prepared by adding a fluorescent DNA dye to the single cells known as propidium iodide. This dye will bind the DNA. Then via the flow cytometry process, the DNA will emit a fluorescent signal. The total fluorescence emitted from the cell will vary because of the amount of DNA present. Therefore, the G2 and M phases often cannot be distinguished from one another, because they share similar DNA content. Flow cytometry can confuse the cellular DNA content of two cells from that of one cell, referred to as a finding doublets. A correctional modification can be applied to some flow cytometers known in the industry as a Doublet Discrimination Module6.
There are some newer methods for identifying DNA damage by treating individual cells with alkylating agents forcing monoclonal antibodies to bind with DNA in situ. The expression is measured using flow cytometry with indirect immunofluorescence.
The analysis of cyclins and CDKs (cell cycle regulators) in the cell cycle is more complex than measuring DNA because different cyclins can become active within different parts of the cycle. Progression through the cell cycle is managed by cyclin-dependent kinases (CDKs) and cyclin complexes. Without CDK activation, mitosis is prevented. Regulation of the cell cycle is largely done by the phosphorylation of CDKs and cyclins.
It is common for flow cytometry data to be presented in the way of single cell view snapshot measurement or time-lapse type measurements. A single time-point measurement can show the percentage of G1 cells, S phase cells, and G2 or M phase cells. Essentially, the cell cycle phase distribution patterns have been shown to change based on a diseased state i.e. cancer.
The future of flow cytometry will be focused upon the development of 3D cell imaging. The NIH initiated approval of a major grant to expand the capabilities of the WOLF G2 Cell Sorter, a NanoCellect Biomedical proprietary instrument used for rapid and gentle cell-sorting. The ability to handle 3D images of millions of single cells in a flow cytometer will prove to be an invaluable tool for researchers. Currently, the stage is set for these advances to take place. We can expect to see a great deal of expansion growth in this arena because it will help researchers uncover the mysteries of advanced disease and other therapeutic interventions7.
Sources:


