Flow cytometry via a flow cytometry machine provides a great deal of power for hypothesis testing, it also generates a vast amount of data, which is typically analyzed manually through a process called “gating”. For large experiments, such as high-content screens, in which many parameters are measured, the time required for manual data analysis as well as the technical variability inherent to manual gating can increase dramatically, even becoming prohibitive depending on the clinical or research goal. A gate is a numerical or graphical boundary that can be used to define the characteristics of particles to include for further analysis. The gating process is simply selecting an area on the scatter or histogram plot generated during the flow experiment that decides which cells you want to continue to analyze.
First, you need to have an understanding of what flow cytometry is. Invented in the 1960s, and first described in 1972, FCM or fluorescence-activated cell sorting (FACS), as it was first called, has transformed a number of fields, most of which being cellular and clinical immunology. It allows for the quantification of surface and/or intracellularly expressed molecules (also known as antigens) for a single cell within a larger population, doing so in a high-throughput fashion, providing measurements for hundreds to thousands of cells per second.
Basically, a flow cytometer is made up of three main systems: fluidics, optics, and electronics. The fluidics system transports particles in a stream to the laser beam for interrogation. The optics system consists of lasers to illuminate the particles in the sample stream and optical filters to direct the resulting light signals to the appropriate detectors. The electronics system converts the detected light signals into electronic signals that can be processed by the computer. For some instruments equipped with a sorting feature, the electronics system is also capable of initiating sorting decisions to charge and deflect particles.
FCM is particularly useful in situations in which the researcher wishes to discriminate between multiple different cell types within a heterogeneous population and measure their individual frequencies or the expression of a specific molecule of interest. Flow cytometry is the measurement of cell characteristics, which can include cell size, cell count, cell cycle and more. This technique allows researchers to get highly specific information about individual cells. The most critical requirement for efficient and effective flow cytometry analysis is that the sample be a single-cell suspension. This helps ensure that every cell is analyzed independently.
It can take a long time to manually analyze flow cytometry data, using computer software can reduce the time needed. Flow cytometry analysis software has been integral in aiding in this process and can be broadly grouped into two areas: those driven by graphical-user interfaces (GUIs), which can be controlled by mouse and simple keyboard commands, and command-line driven modules, which require at least some computer programing language expertise.
Flow cytometry has emerged as a critical component in the evaluation of primary immune deficiency disorders. The more recent expansion of flow cytometric techniques to evaluate intracellular characteristics, assess intracellular changes associated with activation, characterize apoptosis, and identify antigen-specific T cells has moved this technology into the cell function arena. These newer approaches have enhanced the role of flow cytometry as an important method for the characterization of immune function.
One of the most basic principles of FCM analysis is “gating,” which is the sequential identification and refinement of a cellular population of interest using a panel of molecules (also known as markers) that are visualized by fluorescence in a unique emission spectrum. Although it can be a complex process and involve multiple gates or regions of interest, the process of gating in flow cytometry is simply selecting an area on the scatter plot generated during the flow experiment that decides which cells you continue to analyze and which cells you don’t.
Related: How to Complete Cell Cycle Analysis via Flow Cytometry
The first step in gating is often distinguishing populations of cells based on their forward and side scatter properties. Forward and side scatter give an estimation of the size and granularity of the cells respectively, although this can depend on several factors such as the sample, the wavelength of the laser, the collection angle and the refractive index of the sample and the sheath fluid. Distinguishing populations of cells can be relatively straightforward for cell lines where there is only one type of cell, but it can be more complex for samples where there are multiple cell types.
The ratio between cell size and laser wavelength alters scatter behavior. When cell size is smaller than the excitation of the interrogating laser, the scatter behavior is inconsistent and low-intensity. Accordingly, the laser usually emits light at a wavelength shorter than interrogated particles. A wavelength of 488 or 405 nm is common (1).
The light scatter is measured by two optical detectors. One detector measures scatter along the path of the laser (1). This parameter is referred to as forward scatter (FSC). The other detector measures scatter at a ninety degree angle relative to the laser (1). This parameter is called side scatter (SSC). When measured in conjunction, these two measurements allow for some degree of cellular differentiation within a heterogeneous population.
The measurement of forward scatter allows for the discrimination of cells by size. FSC intensity is proportional to the diameter of the cell, and is primarily due to light diffraction around the cell. Forward scatter is detected by a photodiode, which converts the light into an electrical signal. The intensity of the produced voltage is proportional to the diameter of the interrogated cell (1).
FSC is helpful for distinguishing between cells of the immune system. Monocytes and lymphocytes are two classes of white blood cells. In general, monocytes are larger than lymphocytes and exhibit forward scatter of a higher intensity.
Side scatter measurement provides information about the internal complexity (i.e. granularity) of a cell. The interface between the laser and intracellular structures causes the light to refract or reflect. Cellular components that increase side scatter include granules and the nucleus (1).
Relative to forward scatter, light signals from side scatter are weak. A photomultiplier tube (PMT) is used to measure side scatter because it is a more sensitive optical detector (1).
Side scatter is helpful for identification of cells with varying complexity. For example, monocytes and granulocytes. Granulocytes are characterized by the high volume of cytoplasmic granules. The light reflection off of the granules increases the intensity of the SSC measurement and allows for discernment between granulocytes and monocytes (1).
Doublet cells can significantly affect your data analysis and could lead to inaccurate conclusions. Doublet exclusion as the name suggests, is to ensure you count single cells and exclude doublets from your analysis. This can be critical in cell sorting, cell cycle and DNA analysis. If a doublet containing a fluorescence positive and negative cell passes through the laser (Figure 26), it will produce a positive pulse leading to false positives in both analysis and sorting experiments.
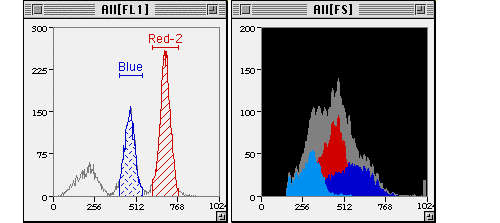
Single parameter histograms can be used to further identify distinct cell types that express a particular marker in a specific population of cells.
http://www.cyto.purdue.edu/cdroms/cyto1/6/softflow/www/gfx1p.htm
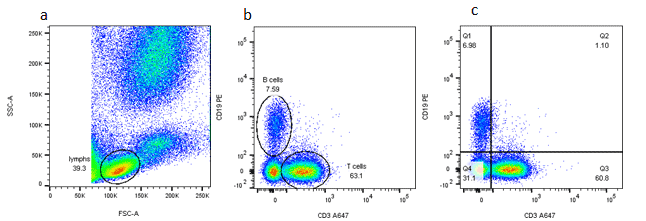
This simple principle of gating can be applied again and again to further determine the expression patterns on particular cell types. This is particularly useful as the number of markers and fluorophores in a single experiment increases. These graphs display two measurement parameters, one on the x-axis and one on the y-axis and the events displayed as a density (or dot) plot. The parameters can be fluorescence, FCS or SSC depending on what you want to show.
Backgating is a useful method of identification of cells to confirm a staining pattern or gating method. It allows you to analyze cells identified in a gate on dot plots with different parameters. This can be useful if you are unsure of your gates, the expression levels, non-specific binding or the presence of dead cells and need additional information to identify your cells. It is usually done when one is trying out a new gating strategy or there is a concern of non-specific staining and false positives.
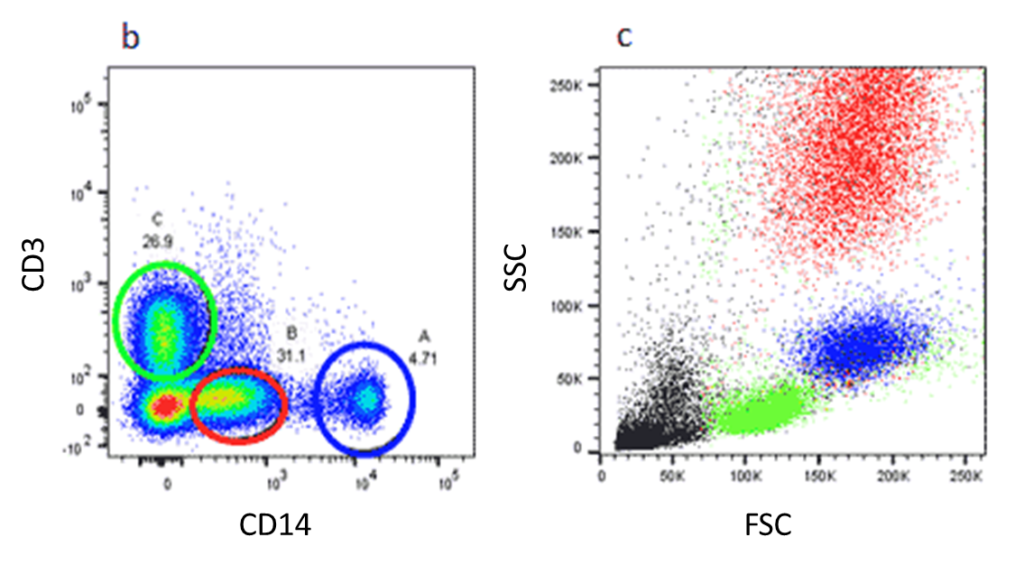 In the dot plots shown above, blood cells are first gated on the basis of CD3 and CD14 expression to separate T cells and non-lymphocytes. The populations in the green, red and blue ovals represent the T cells, granulocytes and monocytes respectively –. To confirm the identity of these populations vis-à-vis this gating strategy, they can be back-gated along FSC and SSC parameters. The dot plot on the right confirms these populations on the basis of their scatter properties.
Related: Next Generation Sequencing and Single Cell Technology
Flow Cytometry has proven to be an invaluable technique among researchers with the measurement and characterization of cells. Gating has been a tried and true method for flow cytometry data analysis and has offered extensive insight to an individual cell from a population, allowing researchers to detect the progression of certain diseases like immune deficiency disorders. In doing so, flow cytometry presents accurate diagnosis in a timely manner and therapeutic intervention becomes a viable option. The application of flow cytometry has become a critical element in cell assessment and has become vastly accessible throughout clinical laboratories today.
Sources:


