
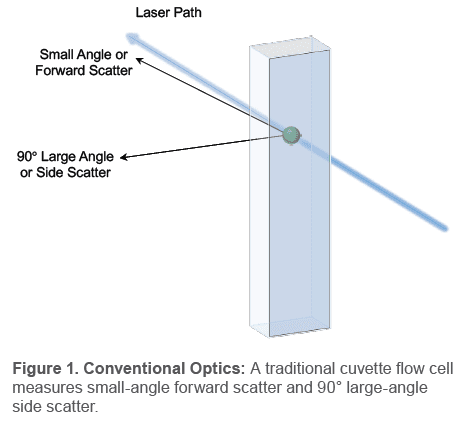
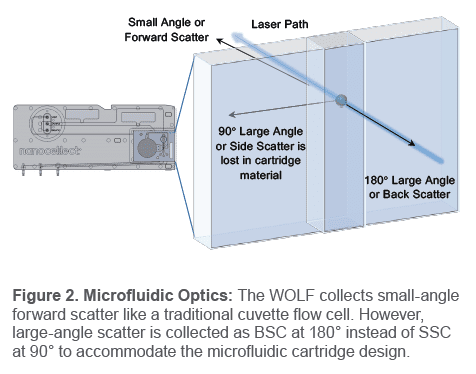
Flow cytometers collect light scatter to measure cellular features, like size and complexity. Traditional cytometers measure small angle scatter, known as forward scatter, to indicate cell size and 90° large angle scatter, known as side scatter, to indicate complexity; this is all measured via a cuvette flow cell. However, the WOLF utilizes a microfluidic flow cell within a disposable cartridge, so it measures some of the light scatter differently.
Forward scatter is collected like a traditional cytometer, but large angle scatter is collected at 180° as back scatter, instead of at 90° as side scatter. Since measuring complexity is critical for flow sorting and analysis, WOLF back scatter was compared to traditional side scatter to confirm equivalent
performance.
Forward scattered light (FSC): Light is scattered by a cell at a very small angle and continues in the same forward direction of its original path (Figure 1). A detector collects this scattered light and translates it into events on a scatter plot. Higher intensity on the plot indicates larger cell size and lower intensity indicates smaller cell size.
Side scattered light (SSC): Light is scattered by a cell at a large angle and travels in a different direction than its original path (Figure 1). A detector measures this at 90° from the original path
and represents the difference in cell complexity level (difference in cell membrane, nuclei, secretory granules, etc.) as different event intensities. Higher side scatter indicates greater cell
complexity and lower side scatter indicates less cell complexity.
Back scattered light (BSC): Light is scattered by a cell at a large angle and collected at 180° from its original path (Figure 2, next page). Like side scatter, back scatter intensity indicates degree of cell complexity.
In a WOLF cartridge, detection at 90° from the laser path is unavailable so side scatter cannot be analyzed. However, detection at 180° is available so back scatter can be measured (Figure 2). This enables cell complexity measurement and may even offer an advantage over SSC for detecting differences in granularity.1
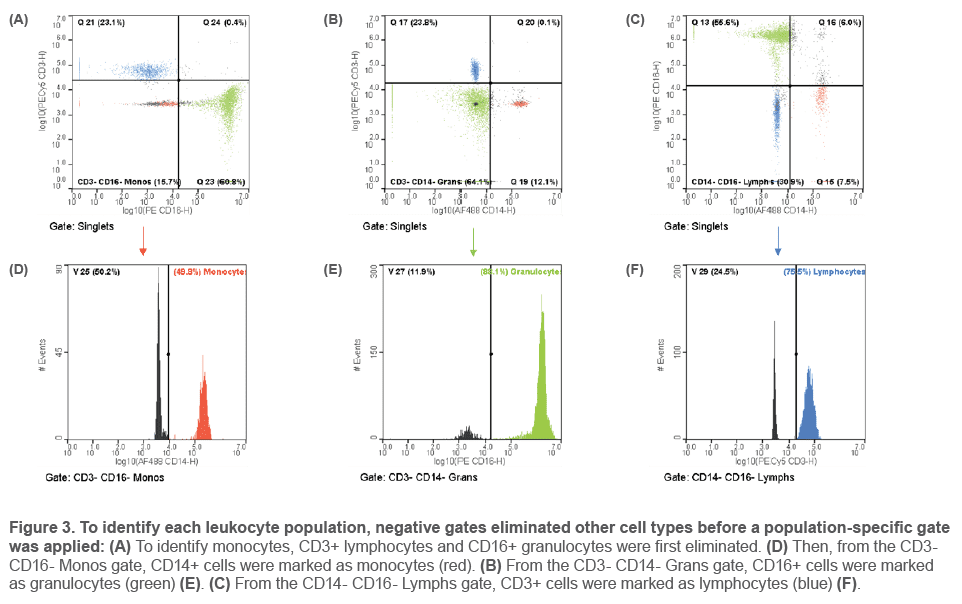
To confirm that populations appear similarly for back scatter and side scatter, a leukocyte immunophenotyping panel was tested. Leukocyte samples contain three distinct populations differing in size and complexity: lymphocytes, monocytes, and granulocytes. Blood samples from three donors were tested on two WOLF instruments – to eliminate donor, cartridge, and instrument variability – and compared to the ACEA NovoCyte traditional cytometer.
Three whole blood samples were incubated with RBC Lysis Buffer (BioLegend #420301) for 15 min at room temperature (RT) in the dark. They were centrifuged at 350 x g for 5 min and the lysed red cell supernatant was aspirated. Cells were resuspended at 1×10⁶ cells/mL in HBSS/2% FBS and incubated
for 10 min at RT with True Stain Fc and Monocyte Blockers (BioLegend #422301 and #426101). Antibodies to the following were incubated with cells for 20 min at RT: Monocytes (AF488 Anti-CD14, BioLegend #301817), Granulocytes (PE Anti-CD16, BioLegend #302007), and Lymphocytes (PE-Cy5 Anti-CD3, BioLegend #300410). Cells were washed once and 10,000 events were collected for each sample. Compensation was set with beads (BD #560497) and gates were set with FMOs prior to analysis.
Debris and doublets were eliminated with Cells and Singlets gates. For each leukocyte population, negative markers eliminated off-target cells (Figure 3) before the final populationspecific marker was gated on and colored to highlight its location on the light scatter plots (Figure 4, next page).
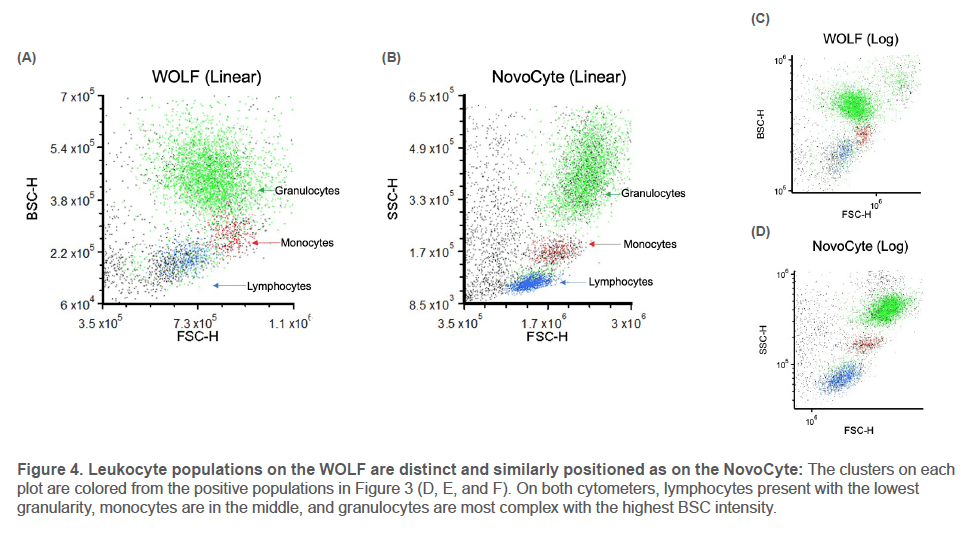
The three leukocyte populations appear on the light scatter plots as distinct clusters with similar relative positions on the WOLF and NovoCyte. The WOLF’s back scatter displays the same hierarchy of cell complexity as the NovoCyte’s side scatter: cells increase in granularity from lymphocytes to
monocytes to granulocytes. This is true across multiple donors, cartridges, instruments, and for both linear and log plots.
The WOLF’s microfluidic cartridges are disposable to ensure sterile sorting and provide simple fluidic maintenance. Due to this design, the WOLF collects back scatter, which accurately distinguishes cell complexity when compared to a traditional cuvette flow cell. Therefore, users can apply conventional granularity expectations to identify, sort, and analyze cells on the WOLF with the added expectation of superior sterility and ease.
TCN-002


