
The cell cycle is used to describe the steps that cells undergo during cell division. There are three discrete phases of the cell cycle. A key measure of the cell cycle is the ploidy or number of copies of the genome. Mammalian cells are diploid, or 2N, and have maternal and paternal copies of the genome, the first phase, G1, is 2N and cells grow in preparation for DNA replication. The second phase is the synthesis or S phase where DNA is duplicated to 4 copies, or 4N, in preparation for cell division. During the last phase, proteins and organelles are synthesized to support two 2N daughter cells and mitosis (M) occurs. There is also an additional 2N phase, G0, where cells are quiescent or differentiated and not dividing.1,2
As cells progress from G1 to the G2/M phase, there is a duplication of DNA material from 2N to 4N to provide for two daughter cells. As a result, cells in the G2 phase (after synthesis and prior to division) can be distinguished by having twice as much DNA as cells that are in the G1 phase.1,2 Therefore, it is possible to distinguish cells in different phases of the cell cycle based on their DNA content. This has been well established in flow cytometry using DNA-binding dyes such as propidium iodide (PI).3 In addition, it is well documented that cells that are in earlier stages of the cell cycle are smaller in size than those that are in later stages.4-6
Cell cycle research has been of interest in oncology to define the proliferative characteristics of cells. Cells selected on the basis of their cell cycle status can be analyzed by RNA-Seq for transcripts that are associated appropriate or dysregulated proliferation as potential drug targets. Identification of cell cycle with dyes that intercalate with DNA can affect both the phenotype of the cell and potentially interfere with downstream molecular biology, such at PCR. Therefore, it is desirable to use methods that avoid the potential confounds of these dyes.
Previous studies have shown that label-free sorting of cells in specific stages of the cell cycle is possible.7 However, traditional, droplet-based cell sorters can reduce viability and RNA integrity due to high shear stresses. In this application note we leveraged the high sensitivity, and gentle microfluidic sorting technology of the WOLF Cell Sorter to sort Jurkat cells in the G1 phase label-free while maintaining high viability.
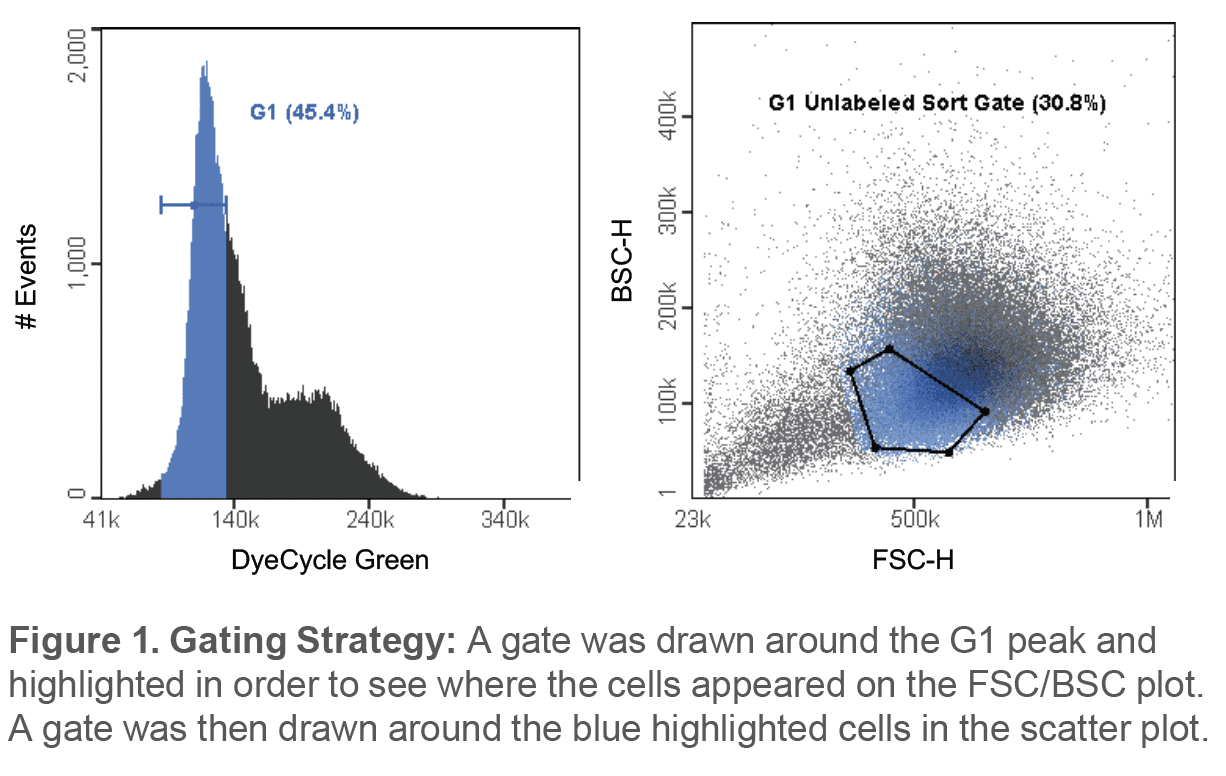
To identify the characteristics of unlabeled cells, we first used a dye to define the population of interest (Figure 1). Here, 500,000 cells/mL of Jurkat cells (ATCC, #TIB-152) in PBS +1%BSA were stained with a live cell cycle dye, Vybrant™ DyeCycle™ Green Stain (Invitrogen, #V35004) for 30mins at 37ºC. Cells were filtered with a 37μm mesh and analyzed on the WOLF using BSC/FSC scatter plot and a FL-1 linear histogram plot (Figure 1). First, a gate was drawn around the cells to exclude debris. The cell cycle graph was then observed through the FL-1 channel. A gate was then drawn on the histogram plot to select the G1 peak and labeled with a blue color to back-gate the corresponding cells in the BSC/FCS scatter plot. This enabled identification of G1 cells in the unlabeled scatter plot. To select the G1 cells, a gate was drawn around the blue back-gated cells to provide for label free selection of G1 cells in subsequent experiments.
A second, unstained sample was then run on the WOLF and the G1 cells were identified using the gate defined in the previous back-gating strategy that used labeled cells (Figure 1). 200,000 G1 cells identified through the scatter gate were then sorted on the WOLF. The sample was divided with half of the sample used to check purity and viability and the other half resuspended in RPMI-1640 medium (ATCC, #30-2001) and incubated for 24hrs. Purity was assessed by analyzing the sorted sample with DyeCycle Green and viability was evaluated with PI (Invitrogen, #P1304MP). After 24hrs, the incubated sample was split into two samples and again stained with DyeCycle Green and PI to determine viability and function after sorting. This experiment was replicated in triplicate.
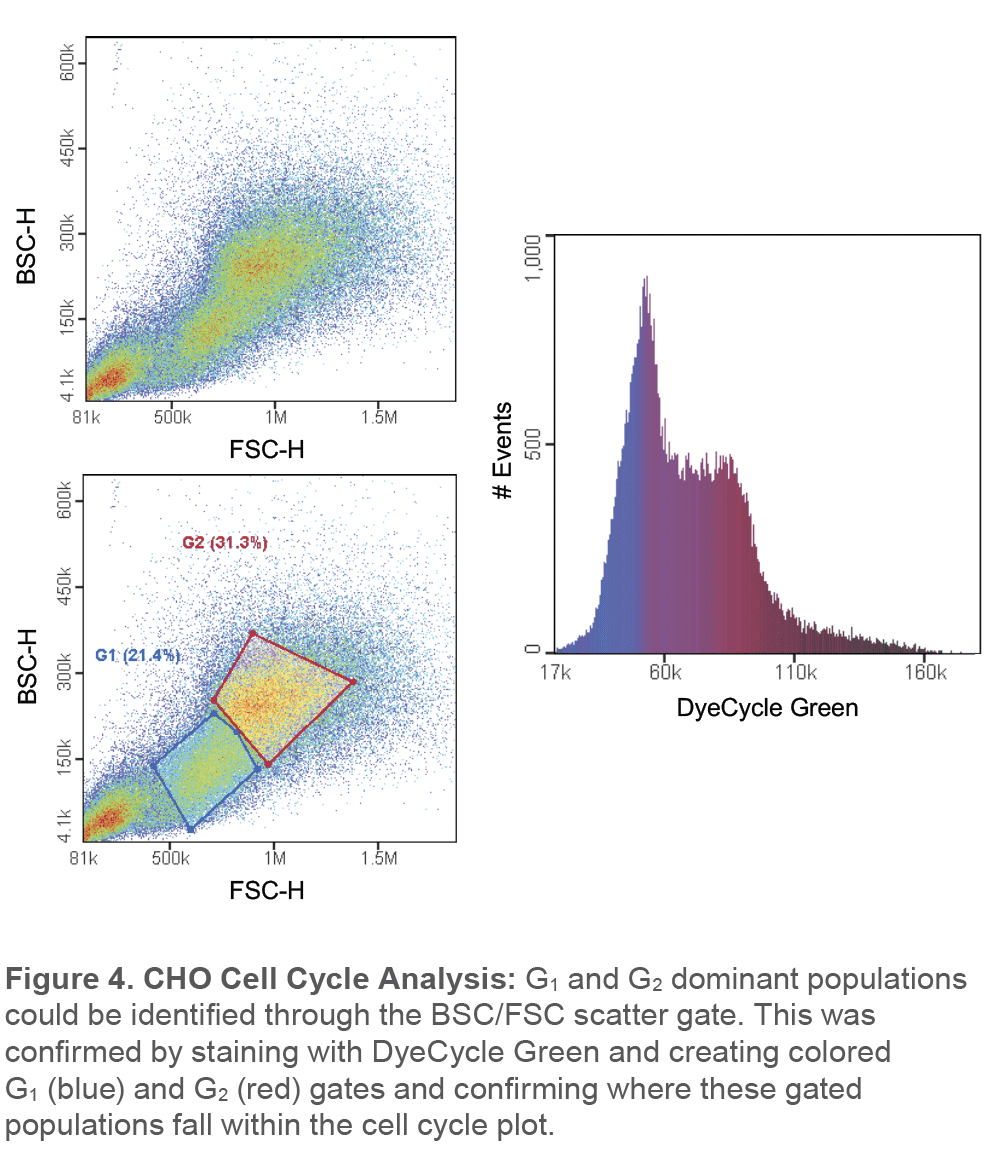
To demonstrate the general applicability of this protocol, CHO cells were analyzed using the same method.
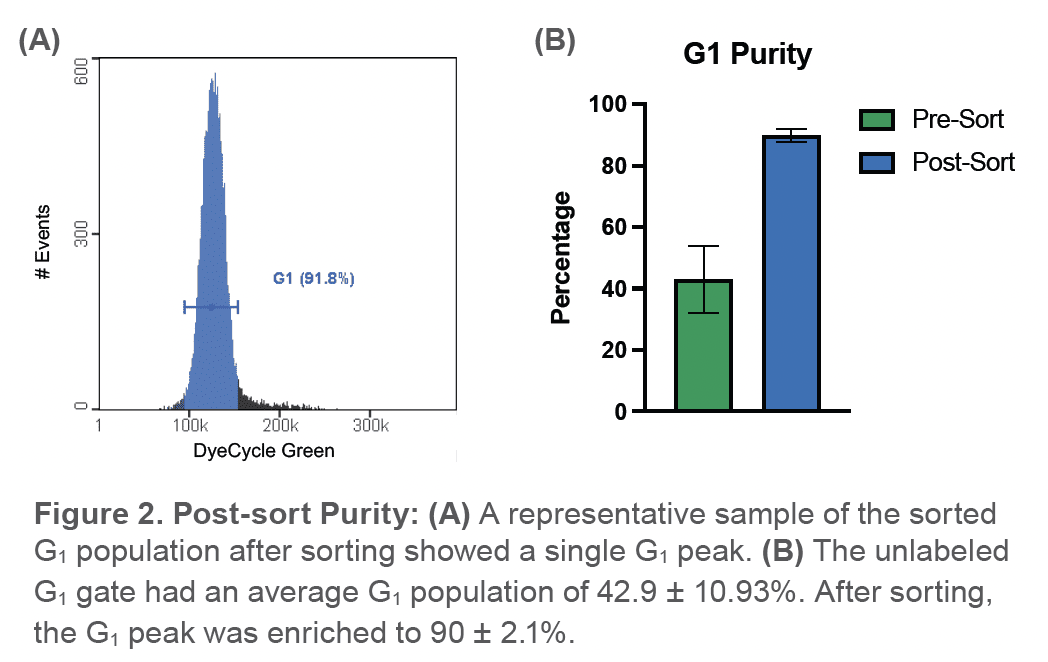
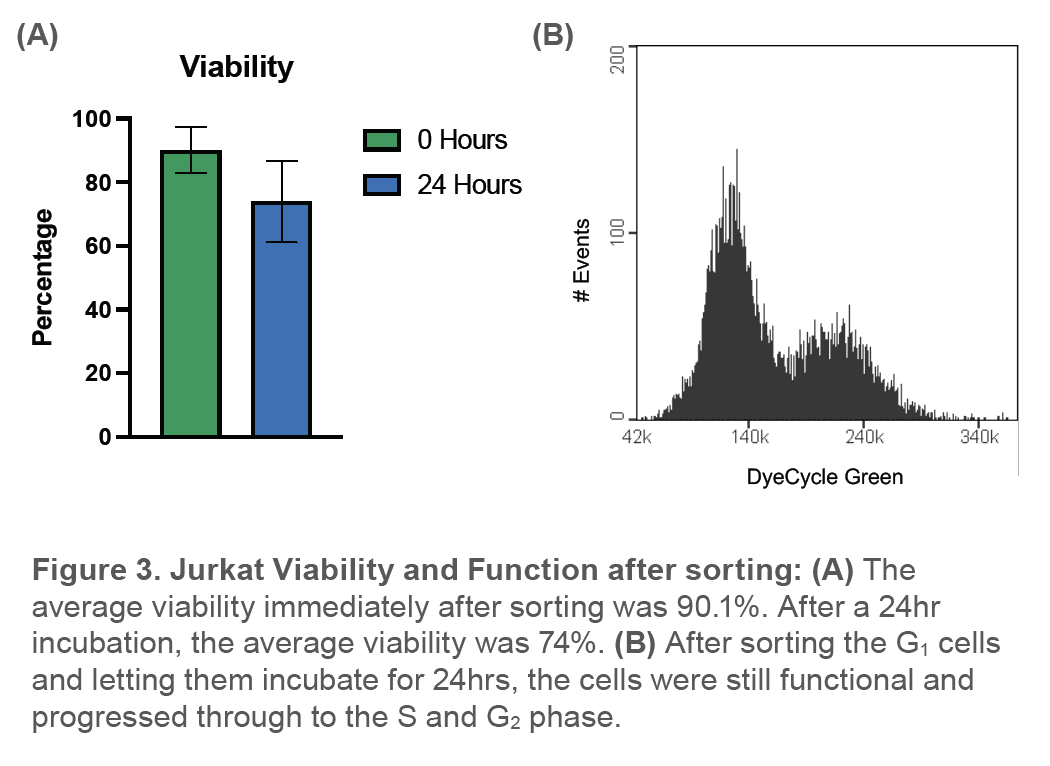
The average percentage of cells in the unlabeled G1 sort gate before sorting was 42.9 ± 10.9%. Post-sort, the average percentage of cells in the G1 phase was observed to be 90 ± 2.1% (Figure 2). Viability immediately after sorting was 90.1 ± 7.92% and after a 24hr incubation, the average viability of the sample was observed to be 73.9 ± 17.2% (Figure 3A). In addition, sorted G1 cells had progressed through to the S phase and G2 phase after being incubated for 24hrs (Figure 3B).
Cho cells were also stained with DyeCycle green and two distinct cell populations in the scatter plot could be observed (Figure 4). Gating on these two cell populations correlated with cells that were predominantly in G1 (blue color) and G2 phase (red color) while cells in the S phase can been found in between both populations (purple color) (Figure 4).
The WOLF Cell Sorter was able to accurately identify cells that are in different phases of the cell cycle using either the DyeCycle Green fluorescence intensity measure of the ploidy or by gating a specific region of the scatter plot identified with a back-gating strategy. Because DNA binding dyes are cytotoxic, and can interfere with genomic assays, we used this
dye only as a guide for gating the G1 gate in the scatter plot. This technique proved to be successful in these experiments as we were able to obtain a single G1 peak and high purity post-sort. Furthermore, after a 24-hour incubation period, the cells appeared healthy and continued to progress to the G2/M phase of the cell cycle which further demonstrates that these cells maintained their function after being sorted on the WOLF. In addition, this workflow proved to be applicable to other cell types. CHO cell cycle analysis revealed better resolution of the G1 and G2 populations in the scatter plot due to their larger size and greater scatter signals. Overall, these experiments demonstrate that the WOLF is accurate and gentle enough to sort live cells in different phases of the cell cycle.
For more information, visit nanocellect.com or email [email protected]
References
APN-031


