Hello fellow scientists, Wolfie here again to tell you about a great new feature on our website—the Spectra Viewer. This invaluable tool can be used to visualize the excitation and emission properties of fluorochromes and helps you to choose which ones are best to combine in a multi-color flow cytometry panel.
Fluorochromes are fluorescent dyes that can be used to stain biological materials such as cells or cellular organelles. The term fluorochrome is sometimes used interchangeably with fluorophore, which is the molecule or functional group that is capable of fluorescence (Apfel & Enderle, 2006). When the fluorophore is excited by a particular wavelength of light, it emits light as a result. We can visualize these properties on the Spectra Viewer to see the wavelengths at which each fluorochrome absorbs (Ex max, or excitation maximum) and emits (Em max, or emission maximum) the greatest number of photons. These are identified by the peaks of each curve. Figure 1 shows an example of what these curves look like for green fluorescent protein (GFP).
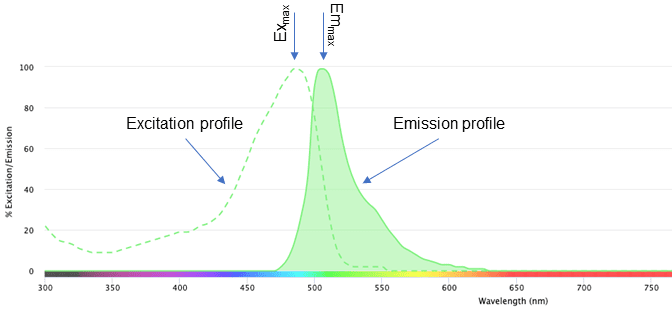
Figure 1: Excitation and emission profiles of green fluorescent protein (GFP) on the NanoCellect Spectra Viewer.
There are several useful pieces of information on this graph. The dashed line represents the excitation profile of GFP. Any wavelength of light on this curve can excite the fluorochrome, up to the Ex max. The solid curve on the right represents the emission profile of GFP, with the peak representing the Emmax. Similar to the excitation profile, any wavelength of light on this curve can be used to detect the emission of GFP.
When we add a second fluorochrome, we can see the excitation and emission profiles of both. In Figure 2, we have added propidium iodide (PI) to the viewer. This is a dye that is used to stain cells and nucleic acids and can help to discriminate between live and dead cells.
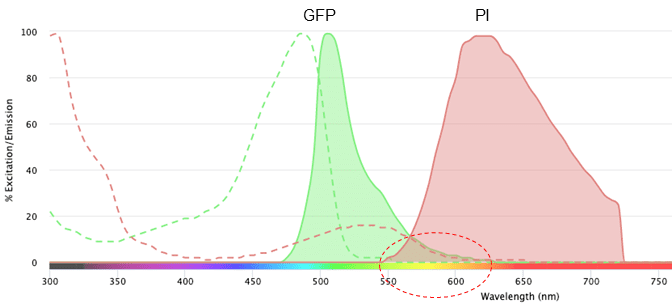
Figure 2: Excitation profile and emission profile of green fluorescent protein (GFP) and propidium iodide (PI) on the NanoCellect Spectra Viewer.
The circled area shows the overlap in the emission spectra of GFP and PI. This overlap means that we wouldn’t be able to distinguish whether the light that is detected between ~550-600 nm is coming from GPF or PI. It is because of this overlap that we must perform compensation during a flow cytometry experiment, but that is a post for another time.
In the above example the overlap is not very large. If we use phycoerythrin (PE) instead of PI, there is a much larger overlap between the emissions (Figure 3), making it even more difficult to know which fluorochrome the light is coming from.
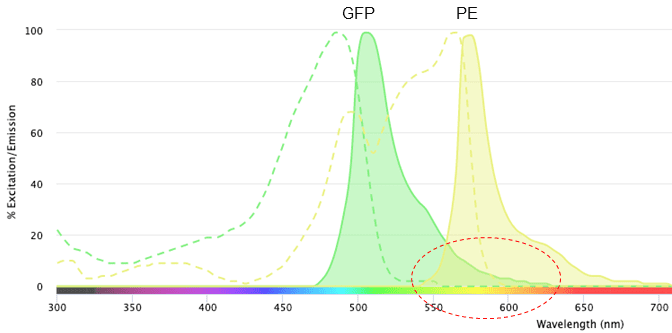
Figure 3: Excitation and emission profiles of green fluorescent protein (GFP) and phycoerythrin (PE) on the NanoCellect Spectra Viewer.
This overlap may not seem like a big issue when using two colors, but can become a headache when trying to design a 15-color panel. And that is where the spectra viewer really shines (hehe, see what I did there?).
When starting to design your multi-color flow cytometry experiment, the first thing to do is open the spectra viewer and choose the instrument you will be using in the dropdown menu on the lower left of the screen (Figure 4).
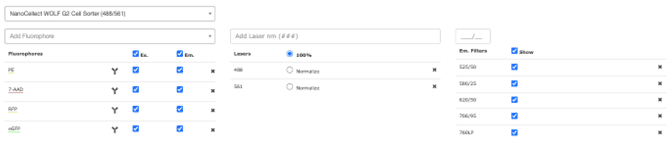
Figure 4: Instrument and filter selection on the NanoCellect Spectra Viewer.
In this case, we chose the WOLF G2 with the 488 and 561 nm lasers. Once you have chosen your instrument, the filters (right) will be automatically populated. When you select the filters you want to use, the graph area will show gray outlined boxes to indicate which wavelengths the filters transmit.
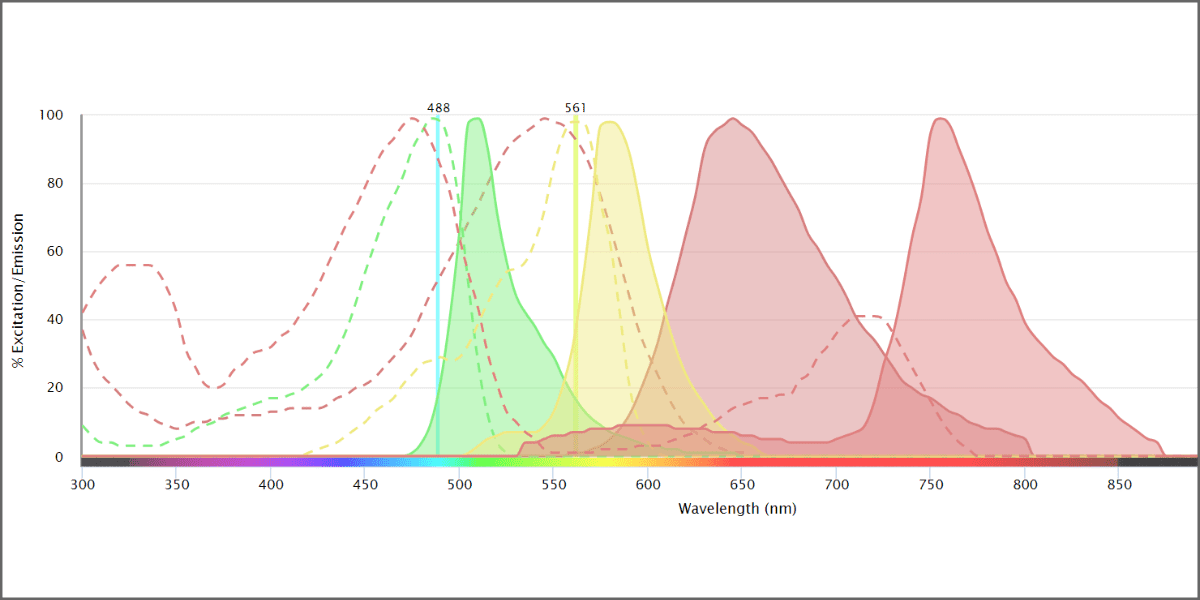
You are now ready to choose your fluorochromes. We selected PE, 7-AAD (viability dye), GFP, and RFP (red fluorescent protein). The graph now shows the excitation and emission profiles for all four fluorochromes. We can see how much fluorescence can be detected by scrolling down and selecting the Filter Coverage tab (Figure 5).
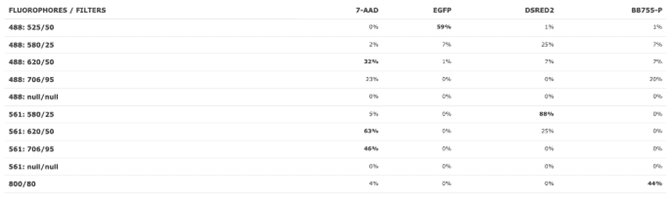
Figure 5: Filter coverage view on the NanoCellect Spectra Viewer.
You can see in Figure 6 that there are some potential overlap issues when PE or 7-AAD are used together with RFP. Based on this information, it may be a good idea to find a different combination of fluorochromes that have less overlap. Some alternatives are dsRed instead of RFP, and BB755 instead of PE. These have less overlap, visualized better by selecting the Normalize option next to the laser selection.
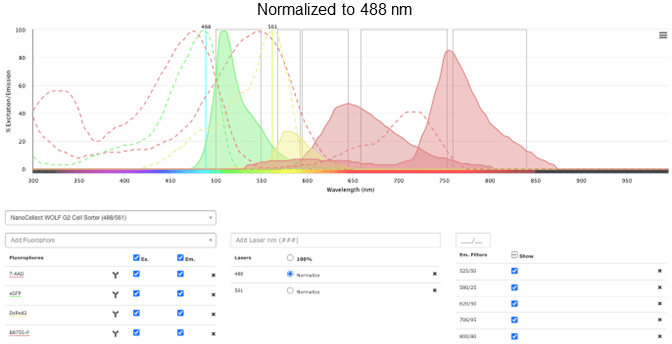
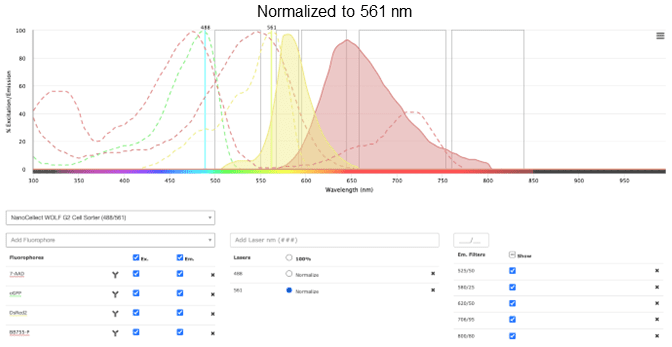
Figure 6: Excitation and emission profiles of GFP, 7-AAD, DsRed2, and BB755-P on the NanoCellect Spectra Viewer, normalized
It may be easier to see the overlap for particular fluorochromes by selecting/unselecting only the ones that are of interest.
You can save the image(s) by taking a screenshot or by choosing a file type from the stacked menu icon on the top right of the graph (Figure 7).
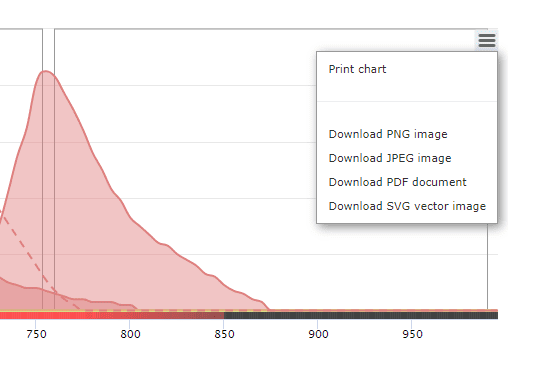
Figure 7: Menu icon to save images on the NanoCellect Spectra Viewer.
This simple, yet powerful, tool can save you a lot of time and frustration (not to mention money) and is a great first step when designing your multi-color panel.
Do you have questions about the spectra viewer or any of our instruments? Need help with your experiments? Just want to chat about the cool things we can do using the WOLF? Ask me in the Wolfie chat box on the bottom right of the screen, or reach out to our technical support team at [email protected].