Hello flow cytometry enthusiasts, Wolfie here with some more thoughts on how to get the best flow cytometry data out of your instrument. In this article we are going to talk about doublets in flow cytometry, especially regarding cell sorting and why it is important to eliminate them as best as you can. It is important to remember that flow cytometry is designed to look at single cells passing through the laser intercept.
Let’s start with a definition. A doublet is when two or more cells stick together and are measured at the same time by the flow cytometer. This is different than an “abort”, which is when a cell enters the processing window while an earlier arriving cell is being analyzed. Aborts do not make it into the datafile, whereas doublets can.
The consequences of failure to remove the doublets is generally poor purity post-sort, and potentially more cells than expected. Imagine sorting a GFP+ population where you have 10% doublets. Failure to remove the doublets would increase your recovery by ~10%, while the purity would decrease by ~10%, compared to a sort where the doublets were removed.
For this, we take advantage of how a signal pulse is generated and measured. As shown in figure 1a, below, as a cell enters the laser, it starts to block light and the fluorochromes begin to fluoresce. This leads to photons being turned into photocurrent by the detectors. As the cell is fully illuminated by the laser, the signal pulse reaches its peak. With the cell traversing the width of the laser interrogation point, the signal falls back to baseline and the system is ready to measure another cell.
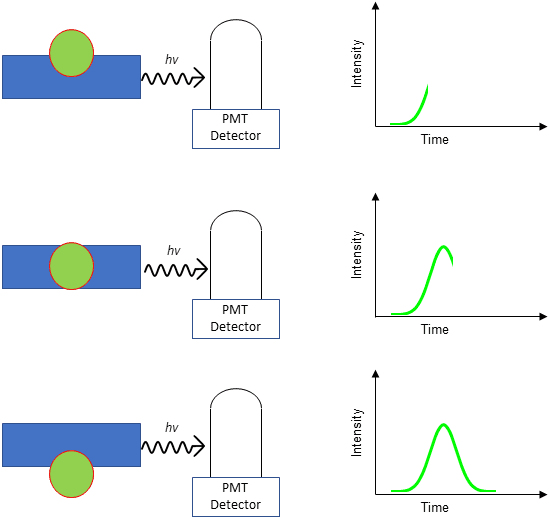
Figure 1a: Depiction of how a signal pulse is generated and measured as a cell passes through a PMT detector.
Figure 1b shows that this pulse is made up of a height, that is the maximal height of the signal pulse, a time of flight (sometimes called “width”), which represents how long the cell was in the signal pulse. The third component is the integral of height and width, termed the “area”.
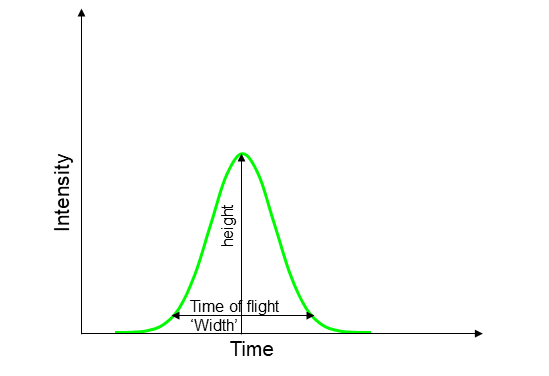
Figure 1b: Depiction of maximal heigh and time of flight (“width”) measurement of a signal pulse generated as a cell passes through a PMT detector.
When two cells are stuck together, a signal pulse is still generated, as illustrated in figure 2a. The consequences of these cells sticking together is shown in figure 2b. While the height of the pulse doesn’t change, as it represents the maximal height of the signal pulse, the time-of-flight increases. Therefore, the area will increase as well.
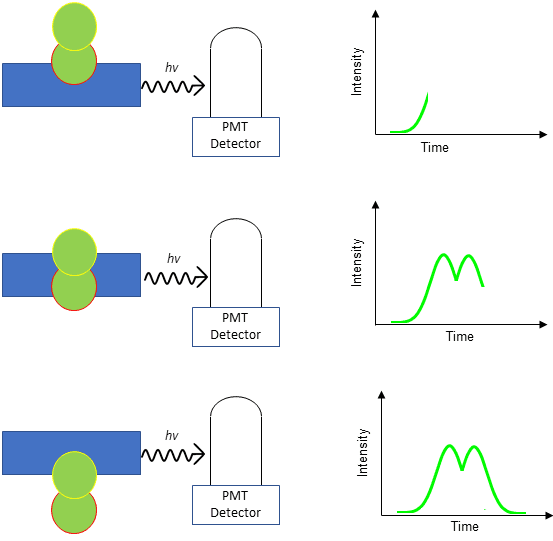
Figure 2a: Depiction of how a signal pulse is generated and measured when two cells are stuck together when passing through a PMT detector.
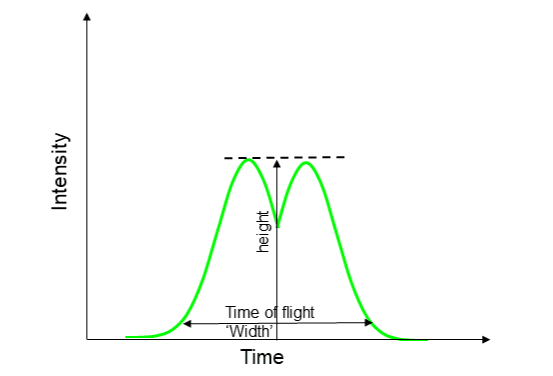
Figure 2b: Depiction of the effects on the maximal heigh and time of flight (“width”) measurement of a signal pulse generated as two cells are stuck together when passing through a PMT detector.
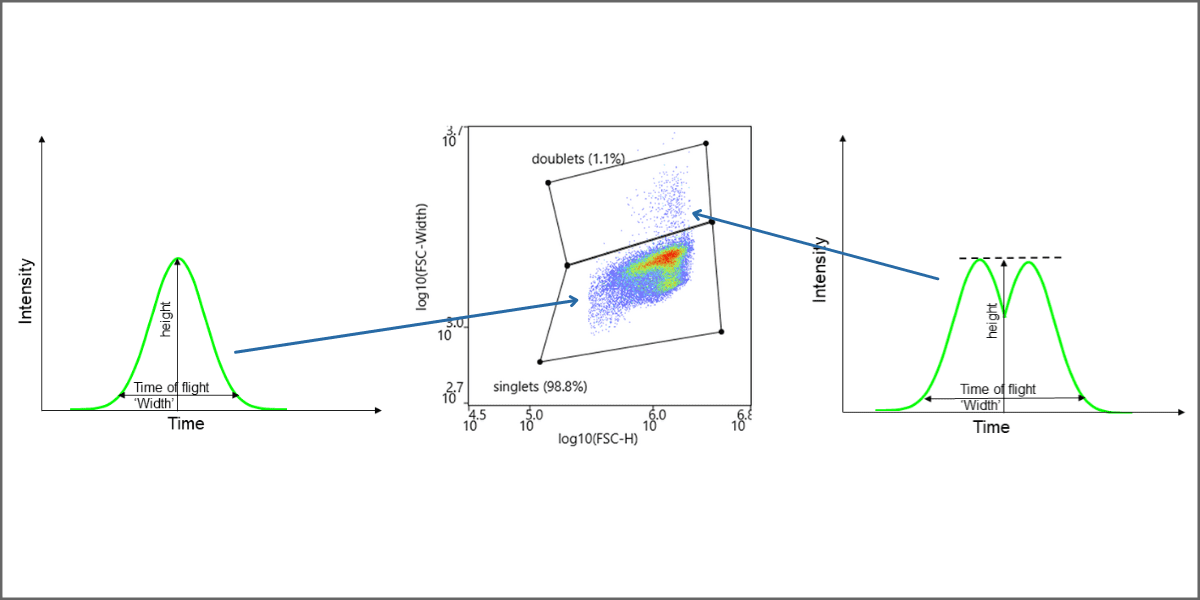
One common way is to take advantage of the fact that the area and width increase when doublets pass through the laser. Thus, if one plots the pulse height versus the pulse width, the single cells should fall along the diagonal, as shown in figure 3a. Doublets would show an increase in the pulse area without the concurrent increase in height, so would be found above the diagonal (red circle in figure 3). With real data, this looks like figure 3b.
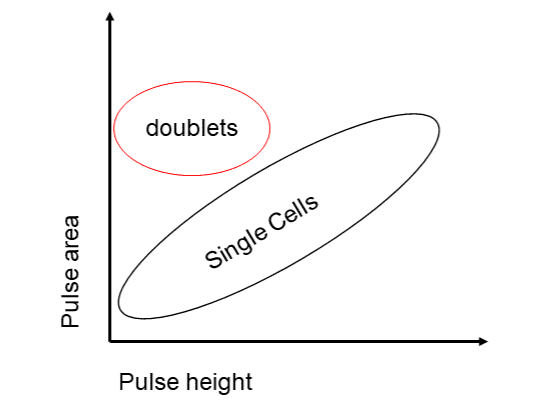
Figure 3a: Depiction of where doublets and single cells would fall when plotted as pulse height versus pulse width.
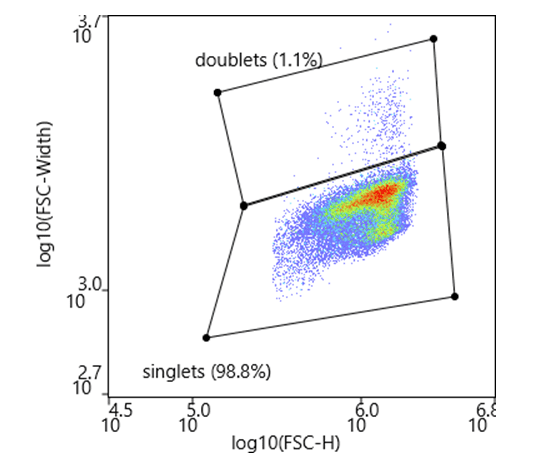
Figure 3b: Depiction of where doublets and single cells would fall when plotted as pulse height versus pulse width with real data.
At the end of the day, removing doublets is an important gate to use, especially when sorting. Failure to do that will reduce the purity of the resulting sorted sample. Fortunately, the data is already being collected by the instrument, one just needs to know how to apply it.
Thanks for reading! Until next time, keep flowin’.
–Wolfie