The Fluorescence Minus One (FMO) Control

A fluorescent molecule is excited by a photon of light. This promotes the molecule to a higher energy state, and to release that energy, this molecule can emit a photon of light that is of lower energy than the excitation photon. When we talk about this emitted photon, we generally consider the emission max. However if one looks at the emission spectra of a molecule such as FITC, it is clear that there are a range of possible photons that can be emitted running from the Emmax all the way out to over 600 nm. This curve is, in effect, a probability curve and the higher on the curve, the more probable a photon of that wavelength will be emitted.
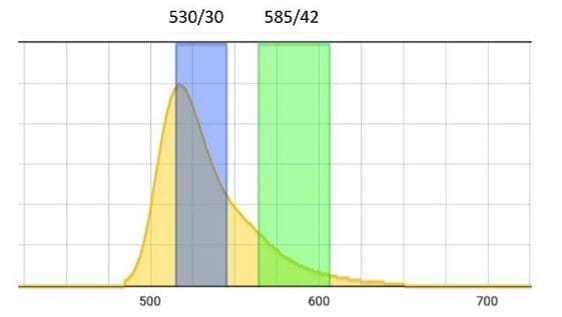
Figure 1: Emission spectrum of Fluorescein. Two filters are highlighted.
By overlaying the different filters that our flow cytometer has, it is clear that the emitted photons can be measured in multiple detectors. This is shown in Figure 2. The fact that there is spectral overlap into the second detector, it is necessary to compensate, which allows the researcher to identify the single positives in the presence of multiple fluorochromes. You can read about that in another blog.
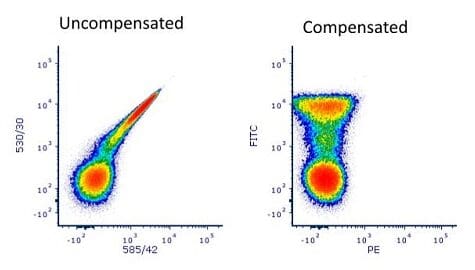
Figure 2: Uncompensated and compensated FITC single stained control.
One of the consequences of polychromatic flow cytometry is that there is going to be a spreading of the data, and without an appropriate control, setting positivity becomes difficult. This is why it is recommended to use the fluorescence minus one (FMO) control as a way to establish proper gating. The FMO control is a sample that is stained with all the fluorochromes except one. This is shown below in Figure 3.
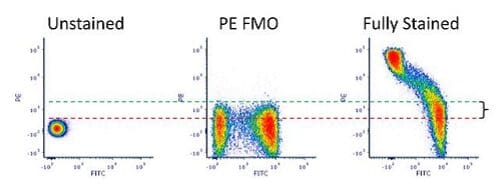
Figure 3: Using the fluorescence minus one (FMO) control to set the positive gate.
On the left panel, we have the full unstained cells. The red dashed line represents the boundary between negative and positive cells. The right panel is the fully stained sample. The middle panel shows the PE FMO control – this sample is stained with all the fluorochromes except PE. Notice how there are events above the red line in this sample. Since this sample does not have the PE label, these cells cannot be positive cells. Therefore, the appropriate place to set the positive boundary is shown in the green line. The bracket between the red and green line is what is termed the spread of the data.
The fluorescence minus one (FMO) control is an essential control in cases where one is trying to identify rare events, dim markers or emergent antigens. By the appropriate use of this control, setting the positive gate is straightforward. It addresses issues related to the spectral spillover that are part of polychromatic flow cytometry. So when you are designing your experiments, don’t forget to add the FMO to the list of critical controls necessary for proper analysis.