
Fluorochromes were first introduced to microscopy in the early twentieth century and are vital for straining bacteria, protozoa, and trypanosomes. They are defined as a chemical that fluoresces (fluorescent dyes), especially one used as a label in biological research. We did not see widespread use of fluorochromes until the 1920s, when fluorescence microscopy was first used to study dye binding in fixed tissues and living cells. They are used extensively as detection reagents in the scope of flow cytometry and cellular imaging. i
Although these reagents proved to be useful, it was not until the early 1940s that Albert Coons developed a technique for labeling antibodies with fluorescent dyes, which gave birth to the field of immunofluorescence. Over the span of a few decades, advances in molecular diagnostics have produced a wide spectrum of secondary antibodies and provided insights into the molecular design of fluorescent probes targeted at specific regions within macromolecular complexes. In the beginning, fluorescent probes such as fluorescein isothiocyanate, Lissamine rhodamine, and Texas red, were successfully used to investigate neurons. However, as advances continue to expand the field of fluorescence, many of these have been replaced with newly developed synthetic analogs1.
In a simple context, a flow cytometer quantifying tool. It captures the emitted photons from fluorochromes present on targets i.e. cells. These fluorochromes can be attached to antibodies or protein, free molecules that become fluorescent when bound to a target (DNA dyes), or sometimes they present with different fluorescent characteristics with varied microbiological environments. Fluorescent molecules are an essential tool in flow cytometry. All fluorochromes have excitation and emission spectrum.
An emission spectrum describes the wavelengths of the spectrum emitted by an energetic object. The excitation spectrum is a range of light wavelengths that add energy to a fluorochrome, causing it to emit wavelengths of light, the emission spectrum2.
Within a flow cytometer, the appropriate ranges of excitation and emission wavelengths of light are selected by bandpass filters. The lines on the atomic spectrum relate to electron transitions between energy levels, if the electron drops an energy level a photon is released resulting in an emission line and if the electron absorbs a photon and rises an energy level an absorption line is observed on the flow cytometry spectrum3.
Fluorescence basically belongs to a family of processes in which susceptible molecules emit light from electronically excited states created by either a physical (for example, absorption of light), mechanical (friction), or chemical mechanism. Generation of luminescence through excitation of a molecule by ultraviolet or visible light photons is a phenomenon termed photoluminescence, which is formally divided into two categories: fluorescence and phosphorescence.
One of the first things we learn about with regards to Fluorescence is that fluorophores emit photons that are higher wavelength than the photons that they absorb. The emission wavelength is dependent upon the electronic configuration of the excited state and the emission pathway. Fluorescence is the property of some atoms and molecules to absorb light at a particular wavelength and to subsequently emit light of longer wavelength after a brief interval, termed the fluorescence lifetime.
When a compound absorbs light (and hence energy), electrons are raised from the ground state to an excited state. Electrons return to the ground state by a variety of transitions which may involve the emission of a quantum of light (radiative transition). This is the process of fluorescence. The emitted light will always be of lower energy, and hence a longer wavelength than the exciting light. Because the colors vary from the use of different dyes, the exciting and emitting light are different and they can be separated from one another incorporating use of optical filters. Fluorescence detection is a sensitive technique because a positive signal is observed against a negative background. The detection of up to 14 compounds fluorescing at different wavelengths permits multiparametric analysis of cells4.
In order to achieve maximum fluorescence intensity, the fluorochrome is usually excited at the wavelength at the peak of the excitation curve. At this point the emission detection is selected at the peak wavelength of the emission curve. The selections of excitation wavelengths and emission wavelengths are controlled by appropriate optical filters. In determining the spectral response of an optical system, technical corrections are required to take into account such factors as glass transmission and detector sensitivity variables for different wavelengths. iii
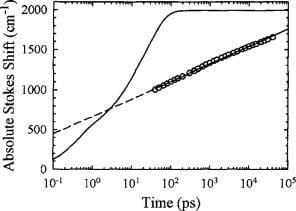
When electrons go from the excited state to the ground state there is a loss of vibrational energy. As a result, the emission spectrum is shifted to longer wavelengths than the excitation spectrum. This result is known as the Stokes Law or Stokes shift. The greater the Stokes shift, the easier it is to view separate excitation light from emission light. The emission intensity peak is usually lower than the excitation peak, and the emission curve is often a mirror image of the excitation curve, but shifted to longer wavelengths. i
In order to achieve maximum fluorescence intensity, the fluorochrome is usually excited at the wavelength at the peak of the excitation curve. At this point the emission detection is selected at the peak wavelength of the emission curve. The selections of excitation wavelengths and emission wavelengths are controlled by appropriate filters. In determining the spectral response of an optical system, technical corrections are required to take into account such factors as glass transmission and detector sensitivity variables for different wavelengths.i
The Stokes Shift is especially important to identify certain proteins and molecule collisions. This is used in the context of studying the specific mechanism of action with regard to cell death or the completion of the cell cycle. Researchers are able to take this flow cytometry data and apply the wavelength measurement to certain cell interactions. This is applicable to the development of new drug discoveries and therapeutic interventions5,6.
Fluorochromes vary in electronic configuration and have unique and characteristic spectra for absorption (usually similar to excitation) and emission. These absorption and emission spectra show relative Intensity of fluorescence, with the relative intensity classically plotted on the vertical axis versus wavelength on the horizontal axis. It is important to understand the origin of the graphs and curves displaying the excitation and emission spectra for a given fluorochrome. i
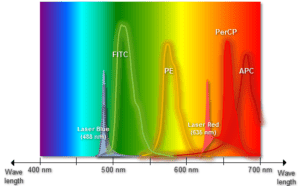
With this application, the use of flow cytometry has grown exponentially more relevant. Excitation is induced at various excitation wavelengths and the intensity of the emitted fluorescence is measured as a function of wavelength. The result is a graph or curve which depicts the relative fluorescence intensity produced by excitation over the spectrum of excitation wavelengths.
Several observations can be made from a typical excitation and emission set of curves or spectra. There is typically a visual overlap between the higher wavelength end of the excitation spectrum and the lower wavelength end of the emission spectrum.
This spectral overlap of excitation and emission wavelengths must be eliminated in fluorescence microscopy, by means of the appropriate selection for an excitation filter. Without the filter, the much brighter excitation light overtakes the weaker emitted fluorescence light and significantly weakens the viewable contrast. iv
The information obtained by using fluorescence lifetime information from biological tissues is determined either through spectroscopy for point measurements (single channel) or imaging spectroscopy (multiple channels) systems. Use of this molecular identification tool is being used in many ways in modern medicine. There are some caveats about feasibility, instrumentation set up and ease of use in certain clinical situations. However, it is a viable and commonly used vehicle as a research resource and in other related modalities. Three more flow cytometry applications include:
Immunophenotyping: Many fluorochromes attach easily to certain antibodies, which will then bind to specific chemical structures or within the cell structure. If these chemical structures are unique to a specific type of cell, then the fluorochrome will identify that cell type. This technique of identifying cells using fluorescent antibodies is called immunophenotyping.
Tissue Characterization: The advances in light delivery and collection systems via fiber optics have facilitated the development of fluorescence-based techniques for non- or minimally-invasive, remote investigations of tissues using endoscopic or catheter systems compatible with certain clinical applications and medical procedures used to diagnose disease such as in-vivo detection of skin cancer (melanoma)7.
Drug Discovery: Emission Spectra/ fluorescence tools offer much in the way of drug discovery research. They offer an avenue to visualize the effects of drug candidates in the cells. ii
These represent just a few of the many flow cytometric applications used by principles of excitation and emission spectra. With the upward shift in technological advances continuing at a rapid rate, we can expect to see this methodology continue to open new doors in molecular diagnostics.
Sources:


