
In oncology, single cell biology has become instrumental in the study of cell heterogeneity and the cellular signaling pathways involved in cancer biology, such as immunotolerance. Single cell transcriptomics in particular has been used to understand the complex nature of tumor cells and specific biomarkers that correlate with disease progression and therapeutic response, including resistance. The quality of single cell transcriptomics, however, relies heavily on cellular isolation and sample preparation to preserve RNA quality and remove dead cells and debris prior to cDNA generation and library preparation. Fluorescence activated cell sorting can be used to collect specific cell populations and eliminate dead or dying cells; however, conventional cell sorting methods that use high-pressure droplet formation can further damage cells, resulting in gene expression changes or general RNA degradation. Furthermore, conventional droplet-based cell sorters generate biohazardous aerosols and risk cross contamination between samples.
The WOLF® Cell Sorter is the best solution for sorting cells in an easy and effective way in applications like single cell genomics, gene editing, cell line development and antibody discovery. With it’s a low-pressure microfluidic cell sorter (>2 psi) used to gently sort cells without forming droplets like conventional sorters. The WOLF further reduces biohazards with a disposable microfluidic cartridge so everything that the sample and sheath fluid touches is sterile, disposable, and free of sample-to-sample contamination. To demonstrate how this gentle, sterile cell sorter affects single-cell RNA transcriptomics in a 10x Genomics workflow, we worked with an academic flow cytometry core at a major cancer center to compare sample preparation in unsorted mouse prostate cells to cells sorted on either the NanoCellect WOLF® Cell Sorter or the Becton-Dickenson FACSAriaTM II.
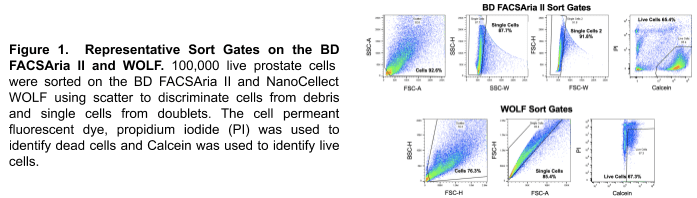
Dissociated primary mouse prostate cells from 2-month-old FVB WT mice were divided into three samples: 1) unsorted controls; 2) cells sorted on a conventional droplet sorter, the BD FACSAria II; and, 3) cells sorted on the microfluidic WOLF cell sorter. Prior to sorting, propidium iodide (PI) was used to identify dead cells and Calcein was used to identify live cells. On the BD FACSAria II, prostate cells were sorted as gently as possible using a large 130 µm nozzle and operating the sorter at only 12 psi. BD FACSAria II sort gates were set to exclude debris using SSC-A/FSC-A, and exclude doublets with SSC-H/SSC-W and FSC-H/FSC-W. Live cells were identified as the PI-negative, Calcein-positive population. WOLF sort gates were also set to exclude debris using BCS-H/FSC-H, and exclude doublets with FSC-H/FSC-W. Live cells were gated as the PI-negative, Calcein-positive population on the WOLF as well.
Representative sort plots are shown in Figure 1. 100,000 cells were sorted on either the BD FACSAria II or NanoCellect WOLF. An estimated 5,000 cells were then loaded into the 10x Chromium Controller. RNA was converted to cDNA and libraries were generated using the Chromium Single Cell 3’ v3 Kit and sequenced with Illumina®. All samples were analyzed with the 10x Genomics Cell Ranger Pipeline to access the quality of the sequencing results. Three independent experiments (3-5 mice per experiment) were performed on different days. BD FACSAria II and NanoCellect WOLF samples were sorted and processed for sequencing on the same days in parallel. BD FACSAria II sorted samples had an n=2 as one BD FACSAria II sorted sample did not generate comparable results.
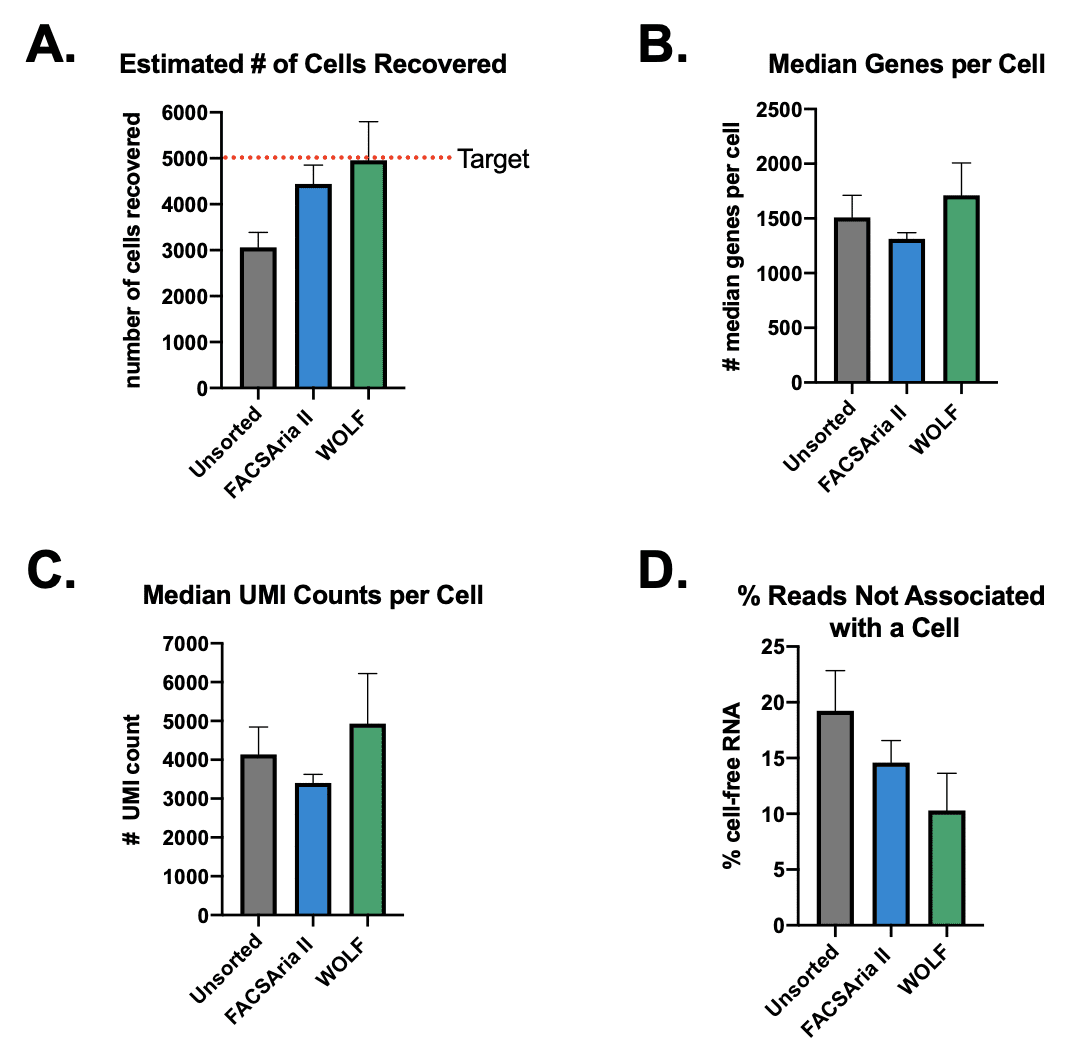
Cell recovery on the 10x Genomics Chromium Controller was targeted to be 5,000 cells in all three conditions: 1) unsorted, 2) BD FACSAria II-sorted and 3) NanoCellect WOLF®-sorted samples. The number of cells recovered is affected by several factors: the percentage of non-viable cells, cell aggregates, and an over/underestimation of cell concentration. The Cell Ranger summary showed there was an average of 3,064 cells recovered from the Unsorted samples, an average of 4,440 cells recovered from the BD FACSAria II-sorted sample and an average of 4,955 cells recovered from the NanoCellect WOLF-sorted samples (Figure 2A). The lowest cell recovery was seen in the unsorted samples, while the WOLF-sorted samples were the closest to the target number of cells recovered. Because the unsorted sample contained debris and dead cells that can be counted as cells, this may have led an overestimate of viable cells loaded, resulting in fewer cells recovered in the Unsorted and BD FACSAria II samples.
The median genes per cell and median unique molecular identifiers (UMI) per cell are both measures of library complexity. The WOLF-sorted samples had the highest average of median genes per cell (1,711) and UMI counts per cell (4,932, Figure 2B, C). The Cell Ranger Summary also states the fraction of reads that are not associated with a cell/barcode, an indicator of cell-free contaminating RNA. In this measure, the WOLF had the lowest percentage of reads (10.3%) that were not associated to a barcode/cell, while and the unsorted sample had the highest percentage consistent with a higher presence of debris and dead cells (19.2%) (Figure 2D). These results indicate that the WOLF-sorted samples had the lowest amount of contaminating RNA from debris and dead cells.
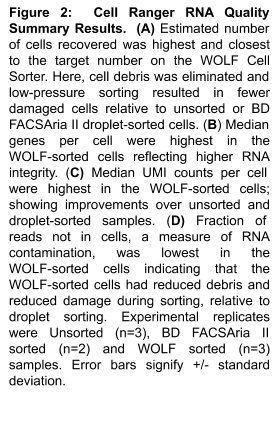
The Barcode Rank Plots help evaluate RNA integrity by indicating whether there is a clear separation between 1) barcodes associated with a cell; and, 2) barcodes that are from empty partitions. Barcodes that are associated with a living cell should have substantially higher UMI counts than background barcodes with no cell or low-quality cells. Therefore, a steep slope, or drop off, between UMI counts and barcodes is observed in samples with high RNA quality. Figure 3 shows the UMI vs Barcode Plots for each individual sample, a much steeper slope or elbow (highlighted circle) can be observed in the BD FACSAria II- and WOLF-sorted samples, relative to the unsorted control sample. These results show that using a cell sorter upstream of the 10x Genomics workflow results in higher RNA quality, while reducing contaminating RNA from cell-free sources. The WOLF-sorted samples also had higher UMI counts that reflect less cellular damage from the cell sorting process.
This experiment shows that using the BD FACSAria II or WOLF for sample preparation results in higher quality scRNA sequencing results by reducing the contribution of RNA from debris and dead cells. In addition, these data show that using a cell sorter to remove dead cells and debris increases the cell count accuracy. Lastly, while both the WOLF and BD FACSAria II-sorted samples resulted in a higher library complexity and a lower fraction of reads that were not associated with a barcode, the WOLF-sorted samples showed the most favorable results. In summary, these results indicate that sample enrichment with a simple-to-use, microfluidic cell sorter has higher RNA integrity over conventional droplet-based cell sorters, likely due to less mechanical stress. As a result, sorting cells with a gentle cell sorter such as the WOLF Cell Sorter for sample preparation in 10x Genomics workflows appears to be the most favorable method to generate high quality scRNA-sequencing results.
APN -008


