
Monoclonality has been defined as a clone that arises from a single cell and is likely to have genetic homogeneity, which is required for biologic production.1 Traditional methods of single cell cloning, such as limiting dilution, have used and rely on Poisson statistical probability to estimate monoclonality. However, this method is known to be time consuming, slow with low-throughput and requires expansion to identify desirable cell candidates.2 In addition, because limiting dilution can result in more than one cell per well, several rounds of cloning are needed to increase the probability of monoclonality.1,3
To better assure monoclonality the WOLF G2 and N1 Single Cell Dispenser can be used to screen millions of cells and specifically sort and single-cell dispense cells of interest to support cell line development needs based on up to 11 parameters.
A common fluorescent parameter is the use of a viability dye to improve cell outgrowth by avoiding dead cells.4 DRAQ7 is a far-red biomarker of cell viability that binds to dsDNA in cells with compromised membranes.5 DRAQ7 can be excited with either blue (488nm) or red (637nm) laser and emits in the 650- 800nm range.6 Here, we used the two-laser WOLF G2 with the 488 and 637nm configuration to sort GFP+ HEK293 cells with DRAQ7 to fully exclude dead cells, maximize plating density and outgrowth when performing single cell cloning.
Cell Preparation
Sheath and sample buffer was composed of 1X PBS (Genesee Scientific, # 25-507), 0.5% BSA (Invitrogen, # 37525), 5mM EDTA (Invitrogen, # AM9260G), and 12.5mM HEPES (Invitrogen, # 15630080). Controls for this experiment included an unstained HEK293T negative control, a 50:50 live:dead HEK293T control stained with DRAQ7 (Biostatus, # DR70250), and a GFP+ HEK293 control. The sample used for sorting had 75% HEK293T and 25% GFP+ HEK293T cells that was stained with DRAQ7 at a final concentration of 1.0x10⁵cells/mL.
Single-Cell Sort and Result Analysis
During analysis, compensation was applied to create a matrix. A scatter plot with a cells gate was applied to an FSC-H vs FSC-width plot to create a singlets gate. The singlets gate was applied to a bivariate plot (DRAQ7 vs FITC).
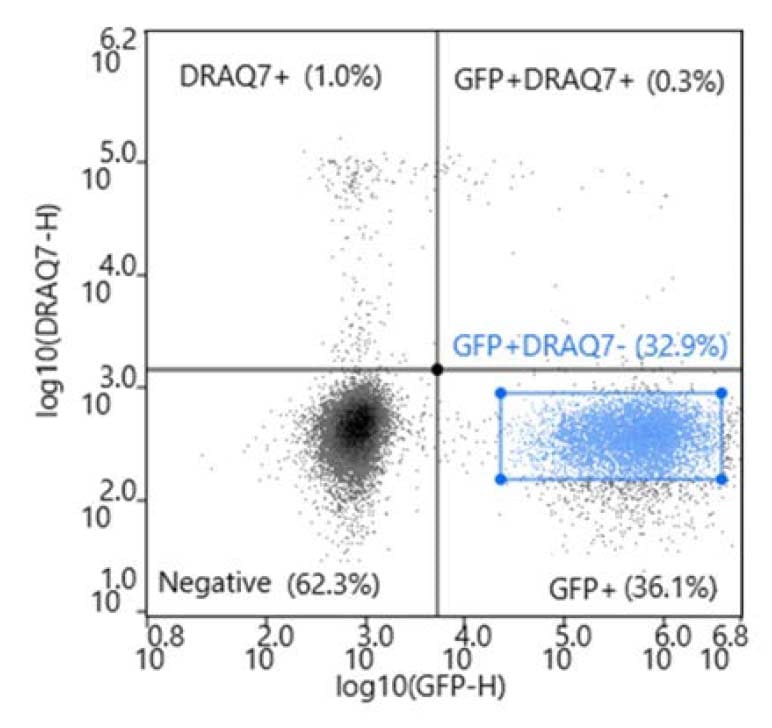
The GFP+ DRAQ7- cells were sorted into three 96-well plates prefilled with 200uL of complete cloning medium composed of Fluorobrite (Invitrogen, # A1896701), 10% FBS (Genesee Scientific, # 25-514H), and 4mM L-GlutaMAX (Invitrogen, # 35050061). In addition, one 96-well plate was prepared with limiting dilution at 1.0 cell/well to serve as a control.
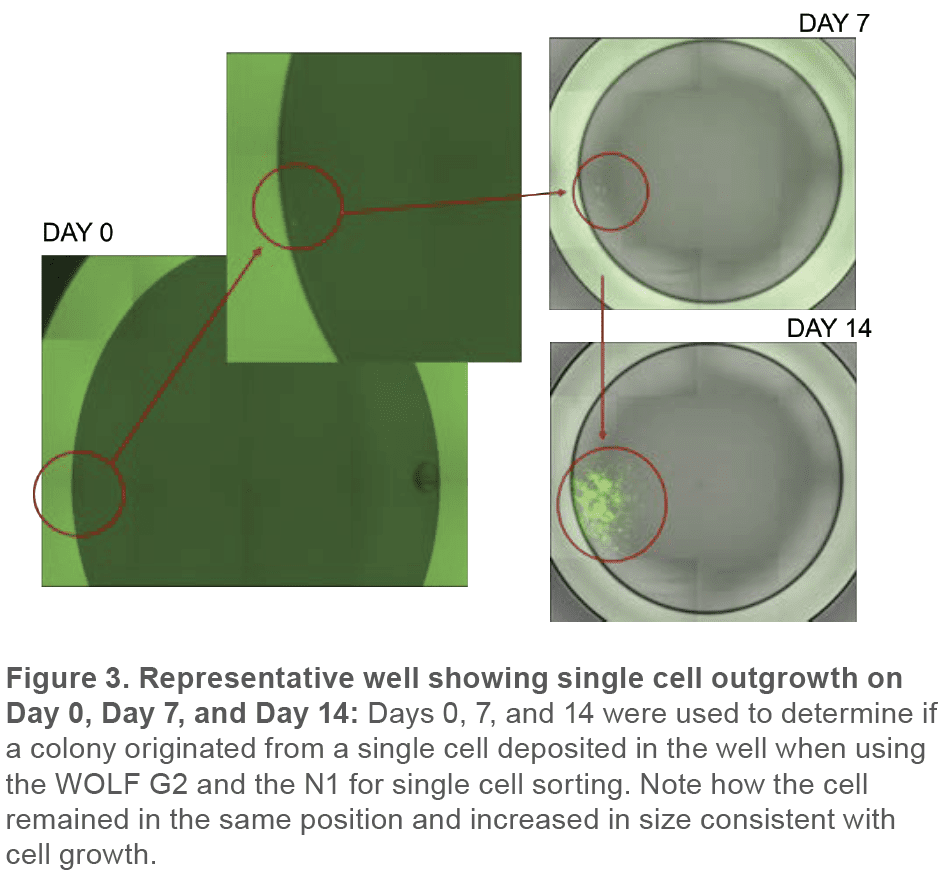
Plates were incubated at 37°C in 5% CO2 and analyzed on Day 0 using the green fluorescence channel with a plate reader (Celigo, Nexcelom) to detect GFP+ cells that could potentially grow into colonies. This analysis was followed on Day 7 and Day 14 using the brightfield and green fluorescence channel to confirm colony formation and determine outgrowth. This experiment was replicated in triplicate using different sterile WOLF sorting cartridges and fluidics for each replicate.
Total Outgrowth
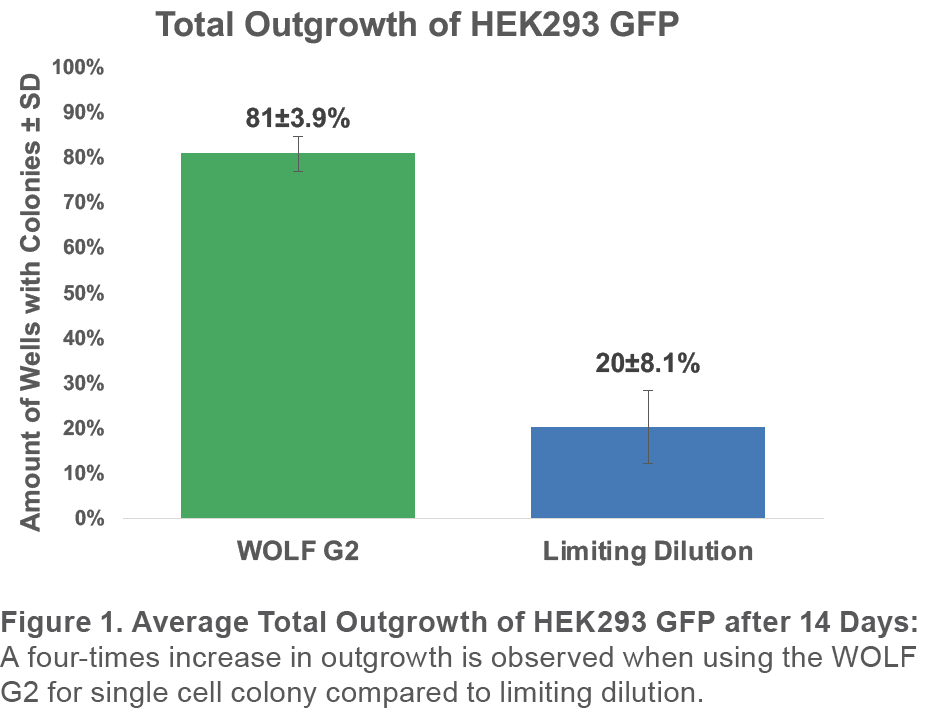
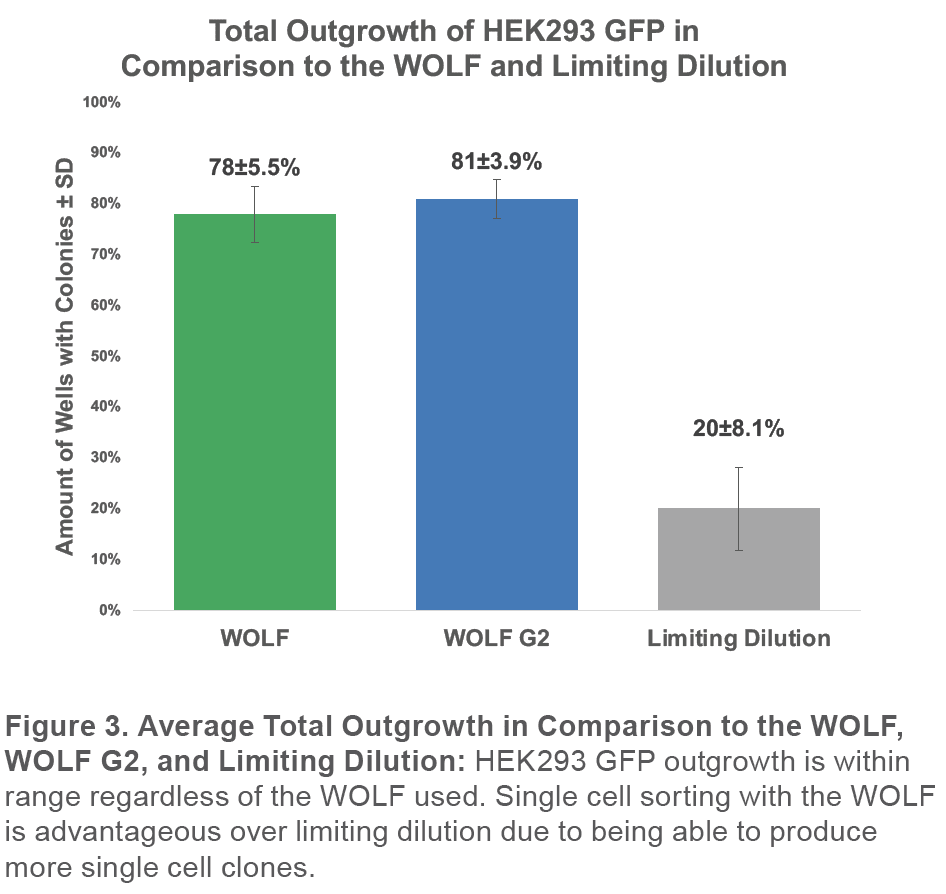
When using the WOLF G2 with the 637nm configuration for single-cell sorting of GFP+ HEK293 with DRAQ7 to exclude dead cells, an average total outgrowth of 81±3.9% was observed. This represented an approximately 4x improvement over limiting dilution outgrowth of 20±8.1% (Figure 1).
Monoclonal Outgrowth
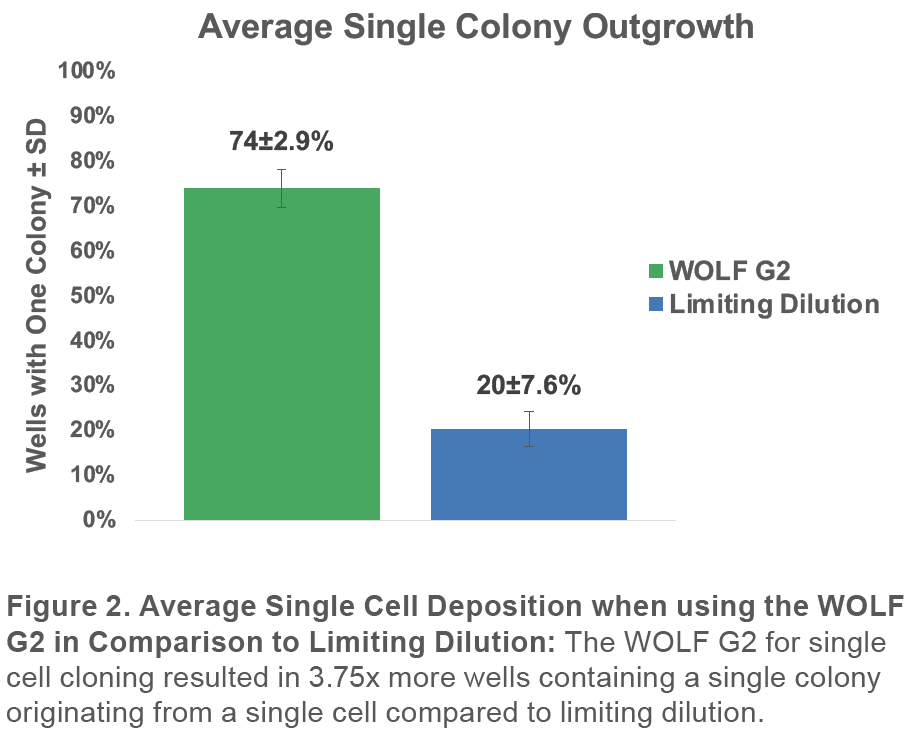
When analyzing the 96-well culture plates on Day 0, 7, and 14, we confirmed that the WOLF G2 resulted in 74±2.9% monoclonal outgrowth. This represents a 3.75x improvement compared to 20±7.6% in the plates prepared with limiting dilution (Figure 2).
Monoclonality was determined by analyzing cells on Day 0, 7, and 14 with the Celigo to retrospectively confirm that detected particles were in fact cells by following their growth into a colony. In addition, multiple days of measurement allowed the verification that a well that contained a colony originated from a single cell (Figure 3).
Finally, the total outgrowth is consistent with our previous results using the WOLF to sort GFP+ HEK293 cells without a viability dye. The previous study had an average total outgrowth of 78±5.5% (Figure 4).7
These results are not surprising because both systems use the same fluidics and sorting mechanism and only differ in the number of lasers and detection channels.
In this work we demonstrated that the WOLF G2 can ensure higher monoclonality compared to legacy methods such as limiting dilution. Here we presented the use of the 488 nm and 637 nm laser configuration of the WOLF G2. The WOLF G2 is also available in 488-405nm and 488-561 nm configurations to serve a wide variety of genetic labels, conventional dyes and emerging chemistries to serve cell line development, as well as other cloning or sample preparation workflows.
For more information, visit nanocellect.com or email [email protected]
References
APN-030


