
While most modern applications of flow cytometry may focus on cells of eukaryotic origin, the first flow analyzers were developed with bacterial detection in mind—an application that is still very much of interest to biologists.1 Unlike mammalian cells, prokaryotes are, at most, a couple microns wide and scatter very little light.2 Additionally, extracellular vesicles (EVs) that fall into a similar size category (0.03 to 1 μm) form yet another modern important scientific spotlight. Collectively, prokaryotes and EVs can be considered “small particles” for the purpose of flow cytometric analysis. The WOLF cell sorter can be utilized for a variety of such experiments. Here, we present the practical limits of detection for the WOLF, as well as examples of microbial detection and sorting data.
Sensitivity testing
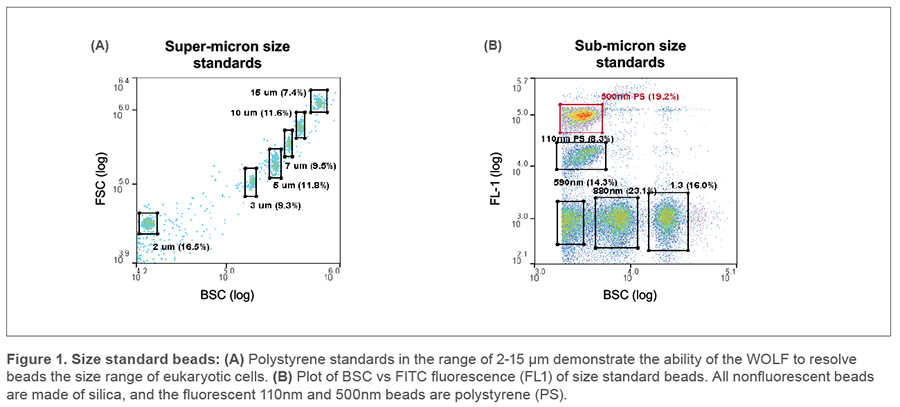
Size standards from Spherotech (CAT #PPS-6K) were diluted 10-fold in PBS and used to demonstrate resolution in the 2-15 μm range using the predetermined “Rainbow” setting on the WOLF (FSC threshold of 8,400). A sub-micron calibration bead mix from Apogee Flow Systems (CAT #1493) containing equivalent ratios of silica and polystyrene standards were diluted 50-fold in PBS to achieve a concentration of 1000 total events per second on the WOLF using settings of back scatter (BSC) PMT gain of 300V, FL1 PMT gain of 350V, and BSC threshold of 1,024, These settings were previously tested for low background noise incidence by analyzing 0.22 μm filtered PBS. Data analysis was performed using WOLFViewer software.
Bead sorting
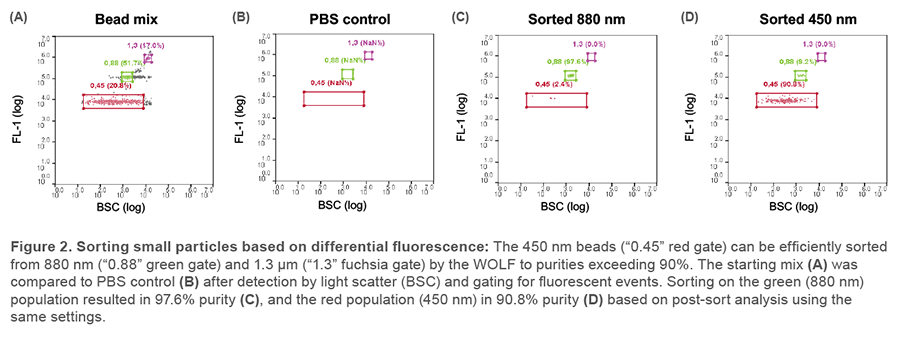
FITC polystyrene sphere standards (Spherotech) of 1350 nm (CAT FP-1552-2), 880 nm (CAT FP-0852-2) and 450 nm (CAT FP-0552-2) were diluted 33-fold in PBS and mixed, then analyzed on the WOLF. The detection settings used were BSC threshold of 1024 at gain 290V. Low incidence of noise was evaluated using a 0.22 μm filtered PBS sample. The beads were distinguished from the noise based on FL1 intensity and the resulting populations were sorted on BSC vs. FL1 plot gates. The resulting purity was evaluated on the WOLF.
Bacterial detection and sorting
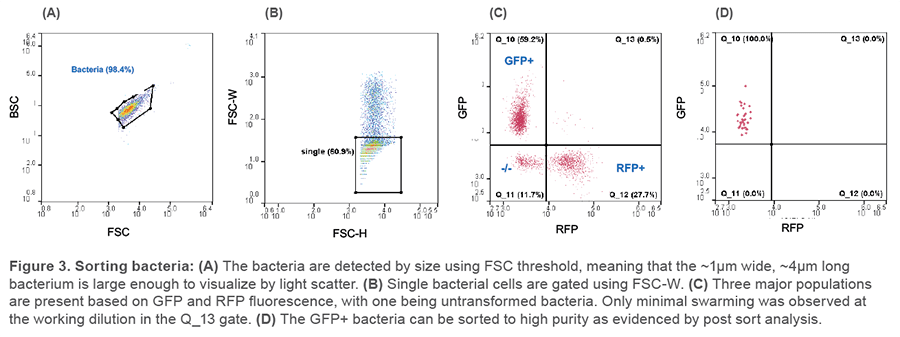
E. coli cultures of WT bacteria and bacteria transformed with either EGFP- or turboRFP-containing plasmids were analyzed on the WOLF using either BSC or FSC threshold of 1,024 and otherwise default “Cell” settings in WOLFViewer software. Manual compensation was used to correct for spillover between the FL1 and FL2 channels corresponding to the respective fluorescent proteins. Culture dilutions were made in 0.22 μm filtered PBS until minimal coincidental detection rate was established (Figure 3C, Q_13).
Sensitivity test
The resolution of typical unstained quality-control beads in the size range of mammalian cells are shown in Figure 1A, next page. To test for the minimal size of detected particles, we used a mix of polystyrene and silica size standards designed for this purpose. After taking a background measurement of filtered PBS, the smallest beads detected by light scatter thresholding were the 590nm silica beads as well as the 110 nm and 500 nm polystyrene beads (Figure 1B). However, the differences in the measured amount of light scatter between the three are very small. As the polystyrene (100 nm and 500 nm) beads are additionally dyed with FITC, we use FL1 fluorescence intensity to discriminate these populations whose light scatter properties overlap. Overall, the WOLF’s sensitivity to small particles is comparable to most currently available commercial flow cytometers, where the 0.5 μm PS bead tends to be close to the practical limit of detection.3-5
The reason that the smallest particles detected are made of polystyrene lies in their refraction index (RI) values. The RI is a number describing how much incidental light hitting the cell or particle is refracted into the detector. Silica has an RI value (1.445) that is much closer to the low refraction exhibited by lipids composing cellular membranes (~1.38- 1.48) than polystyrene (1.605).2 Because of this difference, the lipid membranes of cells and extracellular vesicles scatter light approximately 10-fold less efficiently than polystyrene.3 Consequently, the diameter of the smallest biological particle detectable by flow cytometry is considerably larger than that of the smallest detectable silica or polystyrene bead.
Submicron bead sorting
Fluorescent polystyrene bead standards with diameters of 450 nm, 880 nm and 1350 nm were detected as a mix of three distinct populations based on differential FITC stain intensities after acquisition on a light scatter trigger (BSC) (Figure 2A). A baseline of filtered PBS showed no such particles existed in the media (Figure 2B). The bulk-sorted samples were re-acquired on the WOLF, and the sorted bead populations fell within the correct gates previously set up based on preparations of single-type bead standards (Figure 2C, D). This demonstrates successful sub-micron particle detection, resolution, and sorting on the WOLF system.
Bacterial detection and sorting
E. coli bacteria are detected using light scatter only (typically by BSC or FSC detector), as shown in Figure 3A. This allows for discrimination between the untransformed population and the EGFP-positive or RFP-positive bacteria after using the manual compensation feature of the WOLFViewer software (Figure 3C). GFP-positive E. coli were sorted to high purity from a concentration of about 5×10⁵ cells/ml, as shown by a post-sort analysis, using the same settings, in Figure 3D.
In this note we have reviewed small particle standards for the purpose of determining the light scatter sensitivity of the WOLF cell sorter. The cartridge-based microfluidic system is as sensitive in the sub-micron size range as most other commercial flow cytometers whose detection capabilities typically begin in the realm of 200-500 nm standards.3-5 Specifically, the smallest particles detected by the WOLF were 110 nm polystyrene beads and 590 nm silica beads; fluorescent and non-fluorescent E. coli cells were additionally detected and sorted. This comparison of small bead sizes to bacteria is supported by previous findings that polystyrene tends to scatter at least 4-fold more light than comparably sized EVs and cells due to refractive index properties.6 The typical trigger parameter for cellular detection used in this note (light scatter) is highly influenced by both the diameter and refractive index of the studied material—as explained by the Mie Theory.7, 8
The amount of light scattered by particles with diameters smaller than the wavelength of the illumination laser decays rapidly as the diameter decreases, even at large angles of collection.7 If fluorescently labeled, however, very small vesicles and microbial cells at the edge of detection sensitivity of the instrument may occasionally be better distinguished from noise by fluorescence intensity rather than light scatter, if enough fluorophore is present. In that situation, triggering by fluorescent signal can essentially boost the instrument’s ability to detect particles whose light scattering intensity falls below the smallest allowable thresholds.9, 10 The WOLFViewer software provides this custom triggering capability to enable your small particle research pursuits.
APN-020


