
Cell and Gene Therapy (CGT) enables a new generation of treatments against cancers, infectious diseases and autoimmunity. The manufacturing of CGT products adds regulatory complexity to viral vector production, donor cell enrichment, cell culture, transduction, cell selection and expansion techniques. These methods are at the technological edge of immunology and virology research and development.
Here, we evaluated the 405nm/488nm 2-laser configuration of the WOLF G2 Cell Sorter for its ability to analyze and sort cells throughout the CGT manufacturing process. T cells were isolated and activated, and phenotypic analysis by flow cytometry confirmed cellular activation. Virally transduced
T cells were next sorted and evaluated for purity. Measurement of supernatant interferon gamma, and a cell killing assay confirmed the utility of the WOLF to sort functional, effective cell therapy agents.
Cell Enrichment
Peripheral blood mononuclear cells (PBMCs) were isolated from human blood by density centrifugation (Lymphoprep, StemCell #07851). For pre-enrichment of T cells, negative selection of CD4+ T cells was achieved by magnetic bead separation (StemCell #17952). PBMCs and T cells were cryopreserved in CS10 (StemCell #07930).
Cell Culture Conditions
T cells were cultured in complete RPMI media (cRPMI) [RPMI+Glutamax (ThermoFisher #61870036),10% heat-inactivated FBS (Genesee Scientific, 25514-H), 1% MEM non-essential amino acids (FisherSci #11140050), and 1% antibiotic/antimycotic (ThermoFisher #15240062)].
To culture T cells, cRPMI was pre-warmed to 37°C in a water bath, and then supplemented with 10 ng/mL IL-2 (R&D Systems, #10453-IL-050) before resuspending cells, which were maintained between 0.5×10⁶ – 2.5×10⁶ cells/mL.
CHO cells were cultured in F-12 media (Gibco #21127022) supplemented with 10% heat-inactivated FBS (Genesee Scientific, 25514-H) and 1% antibiotic/antimycotic
(ThermoFisher #15240062).
Cell Staining and Sorting
Cells were first stained with a fixable viability dye (Live/Dead Aqua, ThermoFisher #L34957) in PBS at room temperature. Following a PBS wash, cells were resuspended in 200 µL sterile-filtered PBS (Genesee Scientific #25-507) and 1% BSA (Thermo Scientific #37525) and kept on ice for the remainder of the experiment. Cells were stained for 30 minutes in the dark, using the antibodies listed in Table 1.
Compensation control beads (SpectraComp, Slingshot Bio, #SSB05B) were prepared per manufacturer’s instructions, using 2 µL of each antibody from Table 1, plus a negative control sample.
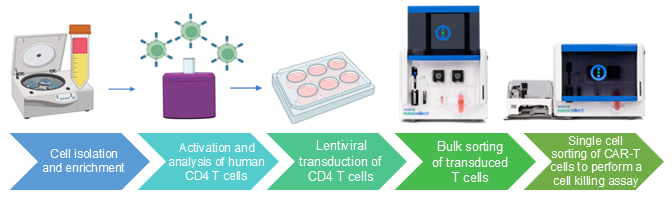
Figure 1. Workflow for cell and gene therapy.
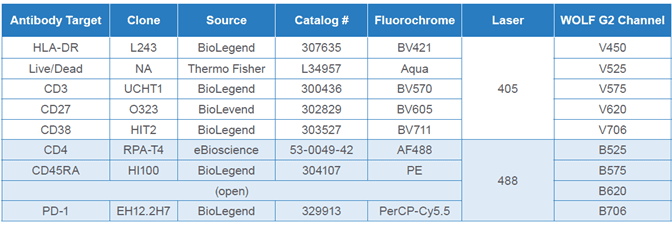
Table 1. CD4 T cell antibodies: Pre-enriched CD4 T cells were stained with the listed antibodies, prior to analysis on the WOLF G2 Cell Sorter, as described in the methods section.
Cell Killing Assay
CHO-K1 cells (ATCC CCL-61) and CHO-BCMA (BPS Bioscience #79500) were seeded at 2.5×10³ cells per well in a 96-well plate, in 100 uL of complete CHO media. One day after seeding the CHO cells, 100 cells per well of human anti-BCMA CAR-T cells (BPS Bioscience #78660) were sorted into the experimental wells using the WOLF G2 and the N1 Single-Cell Dispenser. All cells were then stained with Propidium Iodide (PI; Invitrogen #P1304MP) and Calcein AM (Invitrogen #C14300).
Cytokine Detection
Resting, activated, or CAR-modified T cells (2×10⁵ each) were resuspended in 100 uL cRPMI and incubated overnight in a 96-well plate at 37°C, 5% CO2 and 95% humidity. Takara GoStix (CAT#631285) were used per manufacturer instructions.
Microscope Images
An inverted configuration of the ECHO Revolve microscope, and accompanying ECHO software, was used to acquire trans-illumination and fluorescence images of resting, activated, or GFP-transduced T cells. The ECHO software was also used to count cells for the cell killing assay quantification.
Analysis and Figures
Flow cytometry data was acquired on the WOLFViewer Software. and graphs were generated and rendered in FlowJo V10.8. Figures and text were rendered in Microsoft PowerPoint.
Purification and Activation of Human T Cells
Density centrifugation of 500 mL whole blood yielded 1.2×10⁹ PBMCs. One billion PBMCs were used for subsequent CD4 T cell pre-enrichment, resulting in 1.9×10⁸ CD4 T cells. The human CD4 T cells were morphologically homogeneous before activation (Figure 2A). Upon 4 days of T cell receptor (TCR) stimulation, proliferating T cells were readily observable (Figures 2B and C). These activated T cells were used for subsequent flow cytometry analysis and GFP lentivirus transduction experiments.
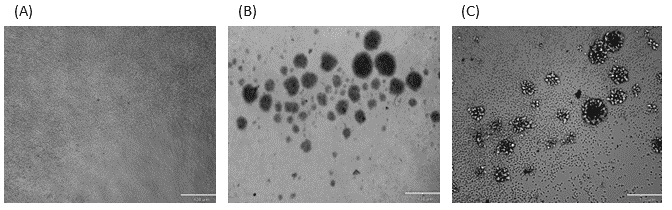
Figure 2. Microscope images of CD4 T cells: (A) Negatively selected CD4 T cells after pre-enrichment, 100x magnification. (B) and (C) CD4 T cells activated with plate-bound anti-CD3 and soluble anti-human CD28 antibodies.
Phenotypic Evaluation of Resting and Activated T Cells
In addition to image analysis, supernatant cytokine analysis and flow cytometry verified T cell activation. Interferon gamma (IFNg) was readily detectable in supernatants from activated and CAR-T cells, while undetectable in resting T cell supernatant samples (data not shown). The WOLF G2 405/488 nm laser configuration was used to acquire and analyze resting or activated CD4 T cells. Antibodies targeting the above markers, and the gating strategy in Figure 3 were applied to analyze >2×10⁴ live, single T cell events (Figure 4). The forward and back scatter profiles reveal an increased proportion of activated T cells, relative to the resting T cells (Figure 3, left panels).
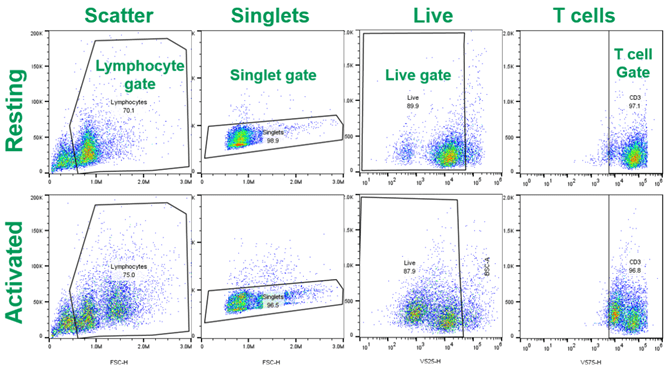
Figure 3. Gating strategy for live human CD4 T cells: Resting and activated CD4 T cells were stained with the antibodies listed in Table 1 prior to analysis on the WOLF G2 Cell Sorter.
Human Leukocyte Antigen DR (HLA-DR) is a human ortholog of the Class II Major Histocompatibility Complex, a family of proteins that presents peptides to T cells. Upon TCR stimulation, human T cells upregulate expression of HLA-DR2. Accordingly, we observed a population of HLA-DR+ cells specifically in human CD4 T cells that had been stimulated with plate-bound anti-CD3 and soluble CD28 (Figure 4, left panels).
CD45RA and CD27 are surface proteins with expression that varies depending on the maturation status of T cells. In combination, CD45RA and CD27 expression are widely used to assess whether a T cell is naïve (CD45RA+CD27+), central memory (CD45RA–CD27+), effector memory (CD45RA–CD27–) or terminally differentiated (CD45RA+CD27–)3. Here, activated T cells exhibited decreased naïve phenotype (45% vs 61%) and increased memory cell phenotypes (Figure 4, middle panels).
Programmed Death-1 (PD-1) is a “checkpoint” protein and is upregulated on cells with effector phenotypes to render the cells more vulnerable to immune signaling-based cell death4. Here we observed a population of cells with increased expression of PD-1 following activation conditions and 14 days of cell culture in cRPMI (Figure 4, right panels).
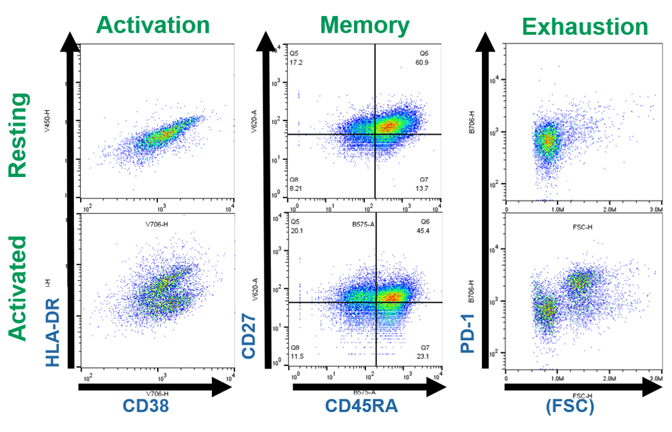
Figure 4. Phenotypic evaluation of resting and activated T cells: Resting and activated CD4 T cells were stained with the antibodies listed in Table 1 prior to analysis on the WOLF G2 Cell Sorter. Events shown were gated on Live, CD3 T cells as in Figure 3.
Lentiviral Transduction and Sorting of Human T Cells
Activated CD4 T cells were transduced with a GFP-expressing lentivirus. Prior to bulk cell sorting on the WOLF, GFP+ cells represented 6.4% of events analyzed (Figure 5A). Following cell sorting on the WOLF, GFP+ cells were enriched greater than ten-fold, relative to pre-sorted cells (Figure 5B).
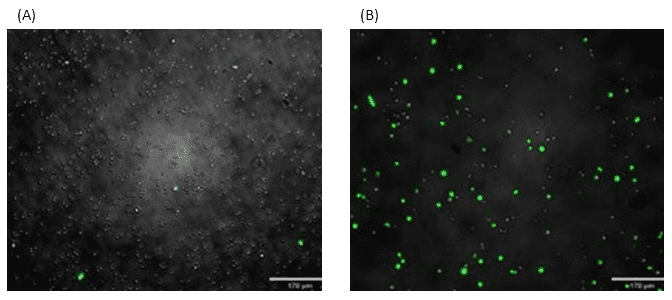
Figure 5. Sorting of lentivirally-transduced human T cells: Activated CD4 T cells were transduced with a GFP-expressing lentiviral vector prior to sorting on the WOLF G2 Cell Sorter. (A) Before sorting, approximately 6.4% of cells were GFP+ and (B) after sorting, the sample was enriched by greater than 10-fold.
Sorting of Functional CAR-T Cells
B Cell Maturation Antigen (BCMA) is a marker expressed by B cells in certain cancers such as Mantle Cell Lymphoma. BCMA is targeted by the first FDA-approved CAR-T cell products and has been widely used as a research tool to evaluate CAR constructs5. Here, we show that the WOLF G2 and N1 can sort functional, BCMA-targeted CAR-T cells. After sorting 100 anti-BCMA CAR-T cells per well, increased cell death was observed in the wells containing CHO-BCMA cells (Figure 6B, B, E), relative to CHO-K1 control cells that do not express BCMA (Figure 6A, C, E).
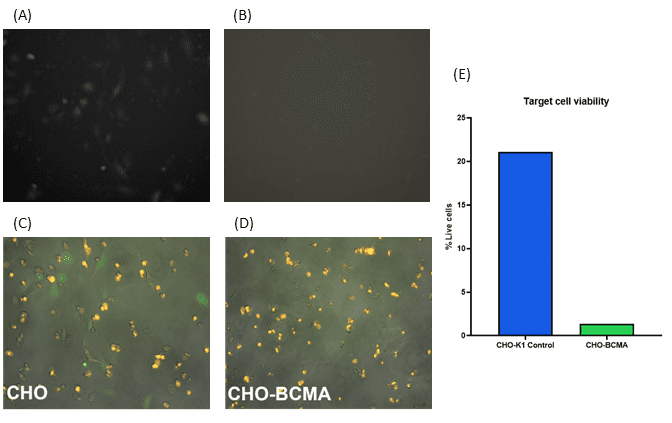
Figure 6. Cell killing assay: 100 anti-BCMA CAR-T cells were sorted into each well of a 96-well plate of pre-seeded CHO negative control cells (6A, C, and E) or CHO cells expressing BCMA (6B, D, and E) using the WOLF G2 Cell Sorter and N1 Single-Cell Dispenser. After 24 hours of coculturing the anti-BCMA CAR-T cells and CHO target cells, T cells were washed off and remaining target cells were stained with Calcein AM and PI to measure viability.
The WOLF G2 Cell Sorter enabled analyses and sorting of effective cell therapy agents at multiple steps of the Cell Therapy production workflow. First, the WOLF was used to detect increased expression of the activation markers HLA-DR and CD38 in activated T cells, relative to resting T cell controls. This accompanied a decrease in cells with a naïve, CD27+CD45RA+ phenotype in the activated T cell experimental conditions. Activated cells also secreted the antiviral cytokine Interferon gamma at higher levels.
The WOLF G2 Cell Sorter also sorted human T cells that were transduced with a GFP lentivirus. This yielded a greater than 10-fold enrichment of GFP+ transduced T cells.
Last, we showed that BCMA-directed CAR-T cells retained functionality after sorting with the WOLF, as shown by their ability to kill CHO-BCMA target cells after being sorted and dispensed with the WOLF G2 Cell Sorter and N1 Single-Cell Dispenser.
Together, these results support the suitability of the WOLF G2 Cell Sorter for isolating highly functional cell therapy agents.
For more information, visit nanocellect.com or email [email protected].
References
1. https://www.fda.gov/vaccines-blood-biologics/biologics-guidances/cellular-gene-therapy-guidances
2. Wang, Z., Zhu, L., Nguyen, T.H.O. et al. Clonally diverse CD38+HLA-DR+CD8+ T cells persist during fatal H7N9 disease. Nat Commun 9, 824 (2018). https://doi.org/10.1038/s41467-018-03243-7
3. Gattinoni, L., Speiser, D., Lichterfeld, M. et al. T memory stem cells in health and disease. Nat Med 23, 18–27 (2017). https://doi.org/10.1038/nm.4241
4. Ando M, Ito M, Srirat T, Kondo T, Yoshimura A. Memory T cell, exhaustion, and tumor immunity. Immunol Med. 2020 Mar;43(1):1-9. doi: 10.1080/25785826.2019.1698261. Epub 2019 Dec 10. PMID: 31822213.
5. Zhang X, Zhu L, Zhang H, Chen S, Xiao Y. CAR-T Cell Therapy in Hematological Malignancies: Current Opportunities and Challenges. Front Immunol. 2022 Jun 10;13:927153. doi: 10.3389/fimmu.2022.927153. PMID: 35757715; PMCID: PMC9226391.
APN-040


