High Viability Cell Sorting and 3’ RNA-Seq for Gene Expression from Single Cells

Introduction
Biological insights continue to be further dissected with the increasing availability of microfluidic and genomic tools that can resolve information at the single-cell level. More importantly, the ability to achieve single-cell RNA sequencing enables transcriptomic analysis of an individual cell and provides information on prevalence, heterogeneity, and gene expression at high biological resolution. However, most labs lack the tools to properly isolate single cells into 384 or 96 well dispenser plates and do not have the capacity to develop a complex RNA-Seq protocol. By combining two technologies, the WOLF Cell Sorter (NanoCellect®) and QIAseq UPX 3’ RNAseq kits (QIAGEN), we provide a complete workflow solution that allows for greater simplicity, improved single-cell RNA-Seq detection, and experimental flexibility.
Here, we present an overview of the complete workflow: from cell detection, single cell sorting, and the experimental design of single-cell RNA-Seq experiments using QIAseq UPX kits. Furthermore, we provide an example of the typical data analysis workflow; from handling of the FCS flow data to RNA-Seq data analysis using GeneGlobe NGS Analysis Center’s integrated cloud-based RNA-Seq data analysis.
Microfluidic Cell Sorting Technology
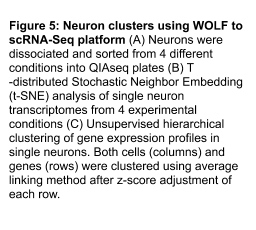
Unlike conventional cell sorters that use high-pressure air- over-water fluidics, the WOLF uses microfluidic cell sorting to gently sort cells at <2 psi of pressure. The WOLF uses peristaltic pumps along with a low voltage piezoelectric actuator to accurately sort cells into 2 different chambers (Figure 1A). Microfluidic cartridges are single-use, sterile and compatible with application-specific buffers such as cell culture media. This allows for zero chance of sample cross contamination, everything that the sample touches is completely disposable (Figure 1B). Furthermore, at under 2 cubic feet, the WOLF and N1 Single Cell Dispenser can be placed directly in a tissue culture hood allowing for a completely sterile environment, reducing the risk of contamination (Figure 1C). In addition, the N1 allows for the selection and sorting of cells in bulk or directly into 96- or 384-well plates (Figure 1D).
Single Cell Dispensing
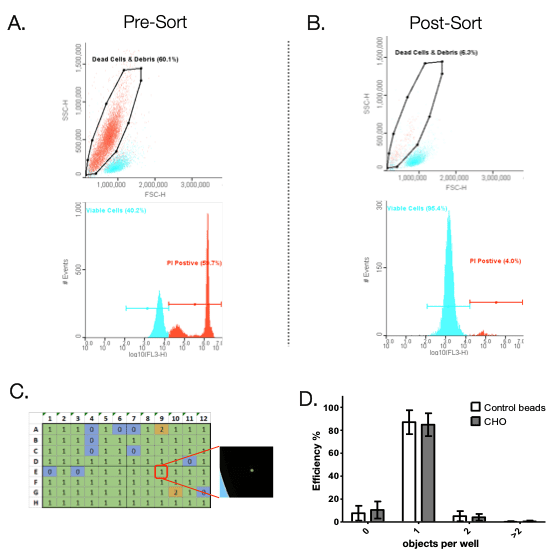
The N1 can dispense 1 to 100 cells directly into a 96 or 384-well plate. Furthermore, with 5 parameters of detection, the WOLF and N1 provide higher rates of singlet detection and live/dead discrimination compared to cell printers and limiting dilution. To demonstrate the ability of the WOLF to sort viable cells from dead cells and debris, a 50:50 mix of heat treated (dead) and healthy CHO cells were sorted and dispensed into a 96-well plate. The mixed population was stained with propidium iodide to label dead cells. The dead cells were then sorted out from the viable cells using the WOLF (Figure 2A). Pre-sort shows that 60% of the cell population was dead. Post-sort analysis shows that the WOLF was able to reduce the dead cell/debris population to only 6% (Figure 2B). Healthy CHO cells were then sorted into 96-well cell culture plates based on the PI negative/viable cell gate (Figure 2B). Single cell dispensing efficiency was analyzed using the Synentec® NyOne imager (Figure 2C). A total of 9 plates, 3 cartridges (3 plates per cartridge) were analyzed. Results showed that the WOLF-N1 single cell dispensing efficiency on 96-well plates had an average of 85%. These results were similar to dispensing control beads, demonstrating that the WOLF-N1 platform is able to sort cells gently without causing cell death.
Directly Sort into a PCR Plate
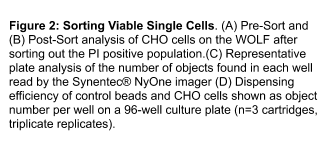
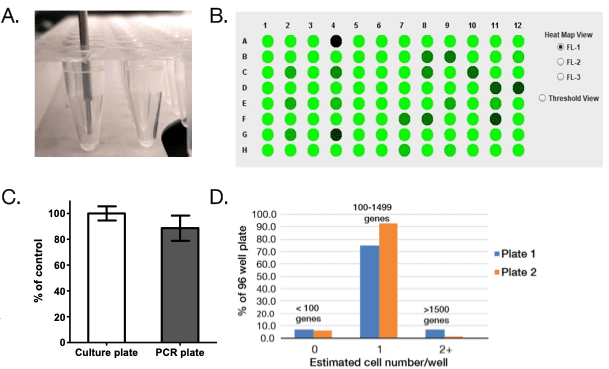
In addition to being able to dispense into a cell culture plate, the WOLF-N1 platform is able to sort directly into a PCR plate and the WOLFviewer software is able to detect the fluorescent intensity of the dispensed single cells (Figure 3A,B). To determine and compare sorting efficiencies with the N1, Dragon Green Beads (15DG) were dispensed into 8 96-well culture plates (Control) and 13 96-well PCR plates. There was no significant difference in sorting efficiencies between cell culture and PCR plates (Figure 3C). Cell culture plates had an average of 98% single cell efficiency while the PCR plates showed an average of 90% single cell efficiency. In addition, single cell efficiency was determined by the number of gene transcripts that were detected from each well. Two plates of 293T cells were dispensed using the N1 and then library preparation was completed using the Qiagen UPX 3’ Transcriptome Kit. cDNA was then sequenced and analyzed. Estimated cell number per well were defined as <100 genes = 0 cells, 100-1499 genes = 1 cell per well, and above 1500 genes = 2 or more cells per well. We estimated 72% of our 96-well plate had 1 cell per well for Plate 1 and 92% of wells had 1 cell for Plate 2 (Figure 2B). These results show that the N1 is able to successfully plate a single cell into a PCR plate and produce results for single cell RNA-Sequencing.
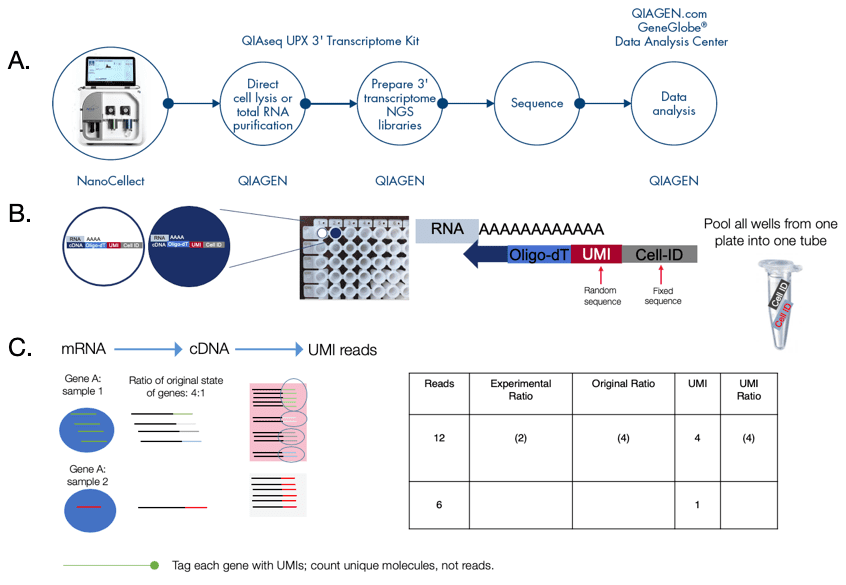
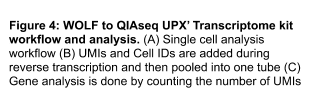
Single cell gene analysis workflow using the WOLF and QIAseq UPX’ Transcriptome Kit:
Starting with a mixture of suspended cells, target cells are selected based on 5 optical parameters on the WOLF and then dispensed into a 96-well QIA-seq plate from the QIAseq UPX’ Transcriptome kit which are pre-loaded with cell lysis buffer (Figure 4A). This allows for a continuous transition from cell sorter to single cell library preparation. Starting with 1-1000 cells or 10pg to 10ng of isolated RNA, this kit uses LNA-enhanced chemistry for increase accuracy, specificity and single cell and sensitivity. Single-cell RNA is first reverse transcribed and each molecule is given a Unique Molecular Index (UMI) and assigned well-specific Cell IDs (up to 384-wells) (Figure 3B). Following reverse transcription with integrated template switching, all cDNAs are combined, enabling simplified, single tube library construction (Figure 4B). The combination of Cell IDs and sample IDs enables up to 18,432 libraries to be sequencing together. The UMIs eliminate library amplification bias for accurate gene expression by using cloud-based read alignment bias. Gene expression analysis is done by counting the number of UMIs instead of the number of reads (Figure 4C). Together, the WOLF and the QIAseq UPX 3’ Transcriptome Kit enable high-throughput next-generation sequencing (NGS) of polyadenylated RNAs from single cells with Illumina® sequencing (Figure 4A).
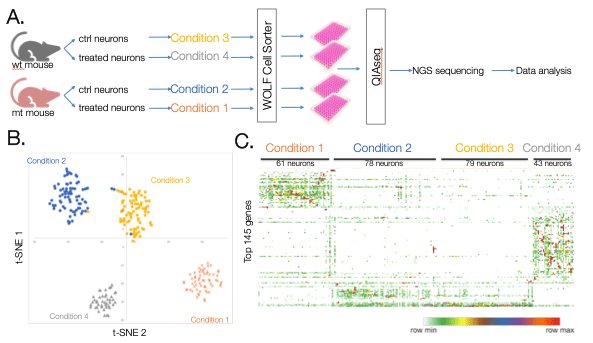
Example: Neuron gene expression analysis using the WOLF and QIAseq UPX 3’ Transcriptome Kit.
Glaucoma is a retinal neurodegenerative disease that causes blindness. In this study, retinas were subjected to unilateral intraocular pressure elevations to induce glaucoma and then subjected to a treatment. Retinas were then dissected from mice and individually dissociated to a retinal ganglion single cell suspension. These cells were then stained with CD90.2 FITC to differentiate neurons and single neurons were dispensed into 4 96-well UPX’ plate using the N1. Control and treated neurons were collected from wild type (wt) and mutant (mt) mice generating 4 different conditions; wt control neuron, wt treated neurons, mt control neurons and mt treated neurons (Figure 5A). Results from this study show distinct gene expression profiles among the 4 different conditions (Figure 5B). Furthermore, similar gene expression profiles can be seen among each neuron within the same condition (Figure 5C). In conclusion, these results show that the WOLF-N1 platform is compatible with the Qiagen UPX 3’ transcriptome kit and confirms that using these two platforms together generate accurate, robust results.